sky

Syntax
Description
c = sky returns the sky colormap as a three-column array with the
same number of rows as the colormap for the current figure (gcf). If no figure exists, the number of rows is 256. Each row in the array
contains the red, green, and blue intensities for a specific color. The intensities are in
the range [0, 1], and the color scheme looks like this image.
![]()
Examples
Plot a surface and assign the sky colormap.
surf(peaks)
colormap("sky")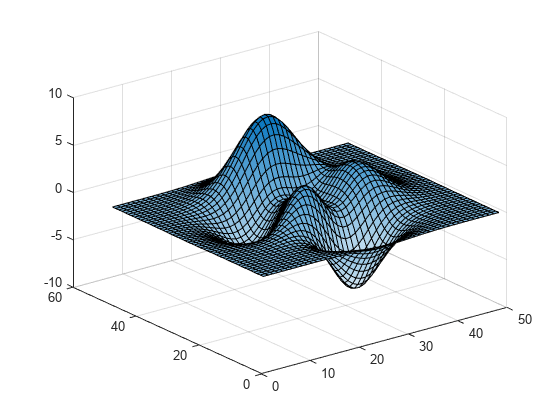
Get the sky colormap array and reverse the order. Then apply the modified colormap to the surface.
c = sky;
c = flipud(c);
colormap(c)

Get a downsampled version of the sky colormap containing only twenty colors. Then display the contours of the peaks function by applying the colormap and interpolated shading.
c = sky(20);
surf(peaks)
colormap(c)
shading interp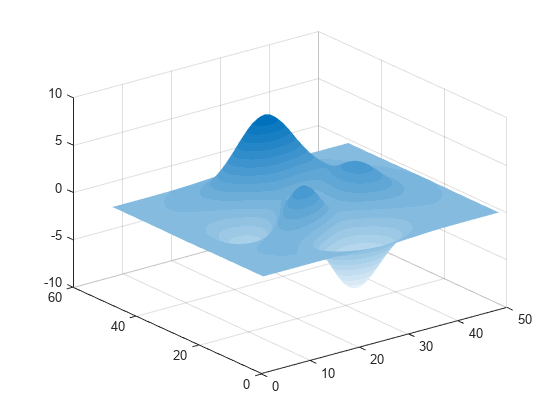
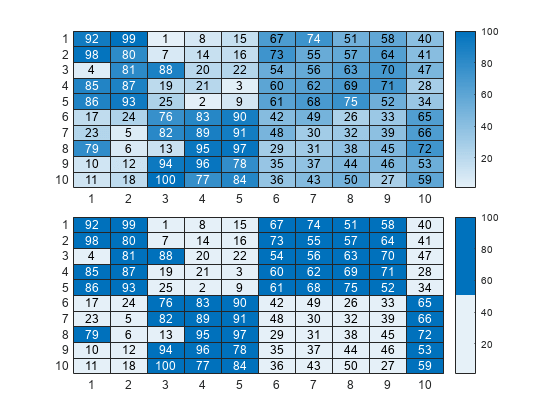
Heatmap charts use the 256-sampling of the sky colormap by default. You can change the sampling by specifying the Colormap name-value argument.
For example, create two heatmap charts in a 2-by-1 tiled chart layout. The top chart uses the default set of 256 colors, and the bottom chart uses only two colors.
tiledlayout(2,1,TileSpacing="compact")

% Top chart with default colors
nexttile
heatmap(magic(10))

% Bottom chart with two colors
nexttile
heatmap(magic(10),Colormap=sky(2))
Input Arguments
Version History
Introduced in R2023a