bar3
3-D bar graph
Description
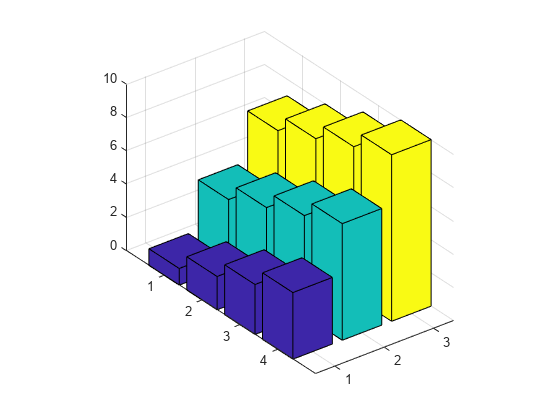
bar3( creates a 3-D bar graph for the
elements of z)z. Each bar corresponds to an element in z.
To plot a single series of bars, specify
zas a vector. For a vector of length m, the function plots the bars on a y-axis ranging from1to m.To plot multiple series of bars, specify
zas a matrix with one column for each series. For an m-by-n matrix, the function plots the bars on an x-axis ranging from1to n and a y-axis ranging from1to m.
bar3(___, sets the width of
the bars along the x- and y-axes and controls the
separation of bars within a group. By default, width)width is
0.8 and the bars have a slight separation. If width
is 1, the bars within a group touch one another.
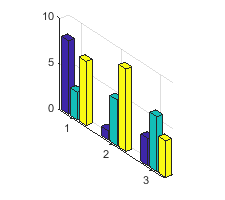
bar3(___, specifies the
style of the bars, where style)style can be 'detached',
'grouped', or 'stacked'. The default mode of display
is 'detached'.
bar3(___, displays all bars
using the color specified by color)color. For example, use
'r' to specify all red bars.
b = bar3(___)Surface objects. If z is a vector, then
bar3 creates one Surface object. If
z is a matrix, then bar3 returns a
Surface object for each series. Use b to set
properties of the bars after displaying the bar graph. For a list of properties, see
Surface Properties.
Examples
Input Arguments
Output Arguments
More About
Tips
The plotted bars can be modified by altering the properties of the returned
Surfaceobjects. For a list ofSurfaceproperties, see Surface Properties.


