Credit Scorecard Modeling Using Observation Weights
When creating a creditscorecard object, the table used
for the input data argument either defines or does not define
observational weights. If the data does not use weights, then the
"counts" for Good, Bad, and
Odds are used by credit score card functions. However, if the
optional WeightsVar argument is specified when creating a
creditscorecard object, then the "counts" for
Good, Bad, and Odds are the
sum of weights.
For example, here is a snippet of an input table that does not define observational weights:
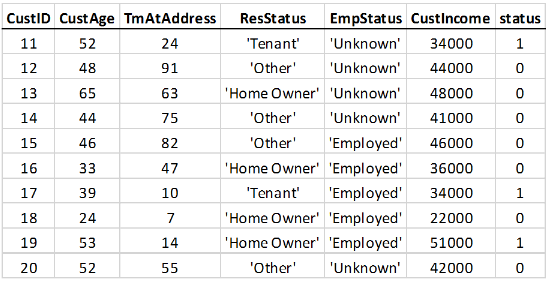
If you bin the customer age predictor data, with customers up to 45 years old in one bin, and 46 and up in another bin, you get these statistics:
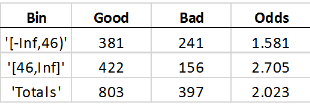
Good means the total number of rows with a 0
value in the status response variable. Bad the
number of 1’s in the status column.
Odds is the ratio of Good to
Bad. The Good, Bad, and
Odds is reported for each bin. This means that there are 381
people in the sample who are 45 and under who paid their loans, 241 in the same age
range who defaulted, and therefore, the odds of being good for that age range is
1.581.
Suppose that the modeler thinks that people 45 and younger are underrepresented in
this sample. The modeler wants to give all rows with ages up to 45 a higher weight.
Assume that the modeler thinks the up to 45 age group should have 50% more weight than
rows with ages 46 and up. The table data is expanded to include the observation weights.
A Weight column is added to the table, where all rows with ages 45
and under have a weight of 1.5, and all other rows a weight of
1. There are other reasons to use weights, for example, recent
data points may be given higher weights than older data points.

If you bin the weighted data based on age (45 and under, versus 46 and up) the
expectation is that each row with age 45 and under must count as 1.5 observations, and
therefore the Good and Bad “counts” are increased
by 50%:
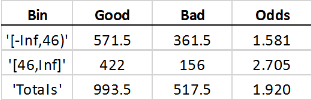
The “counts” are now “weighted frequencies” and are no longer integer values. The
Odds do not change for the first bin. The particular weights
given in this example have the effect of scaling the total Good and
Bad counts in the first bin by the same scaling factor, therefore
their ratio does not change. However, the Odds value of the total
sample does change; the first bin now carries a higher weight, and because the odds in
that bin are lower, the total Odds are now lower, too. Other credit
scorecard statistics not shown here, such as WOE and
Information Value are affected in a similar way.
In general, the effect of weights is not simply to scale frequencies in a particular bin, because members of that bin will have different weights. The goal of this example is to demonstrate the concept of switching from counts to the sum of weights.
See Also
creditscorecard | autobinning | bininfo | fitmodel | validatemodel