plotLaneBoundary
Display lane boundaries on bird’s-eye plot
Description
plotLaneBoundary(
displays lane boundaries from a list of boundary coordinates on a bird’s-eye
plot. The lane boundary plotter, lbPlotter,boundaryCoords)lbPlotter, is associated
with a birdsEyePlot object and
configures the display of the specified lane boundaries.
To remove all lane boundaries associated with lane boundary plotter
lbPlotter, call the clearData function and specify lbPlotter as
the input argument.
plotLaneBoundary(
displays lane boundaries from a lane boundary object or an array of lane
boundary objects, lbPlotter,boundaries)boundaries.
Examples
Create a driving scenario containing a figure-8 road specified in the world coordinates of the scenario. Convert the world coordinates of the scenario to the coordinate system of the ego vehicle.
Create an empty driving scenario.
scenario = drivingScenario;
Add a figure-8 road to the scenario. Display the scenario.
roadCenters = [0  0  1
             20 -20  1
             20  20  1
            -20 -20  1
            -20  20  1
              0   0  1];

roadWidth = 3;
bankAngle = [0 15 15 -15 -15 0];
road(scenario,roadCenters,roadWidth,bankAngle);
plot(scenario)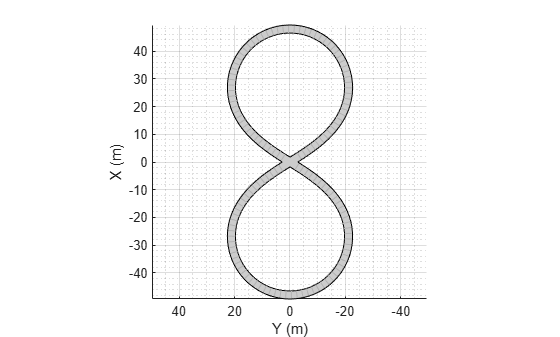
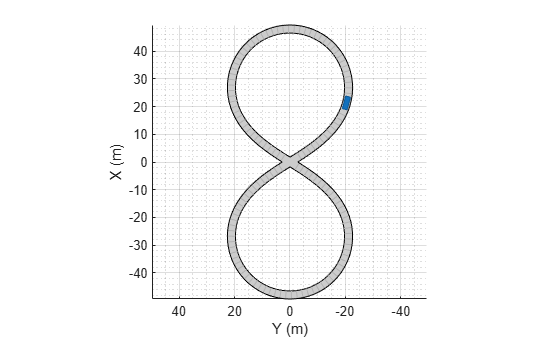
Add an ego vehicle to the scenario. Position the vehicle at world coordinates (20, –20) and orient it at a –15 degree yaw angle.
ego = actor(scenario,'ClassID',1,'Position',[20 -20 0],'Yaw',-15);
Warning: Class ID 1 is not supported for an actor. The drivingScenario object created a vehicle instead. ClassID of actor must be one of these values: 3 (Bicycle), 4 (Pedestrian), 5 (Jersey Barrier), or 6 (Guardrail).
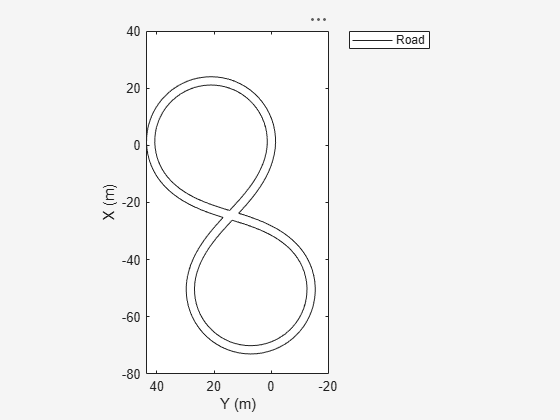
Obtain the road boundaries in ego vehicle coordinates by using the roadBoundaries function. Specify the ego vehicle as the input argument.
rbEgo1 = roadBoundaries(ego);
Display the result on a bird's-eye plot.
bep = birdsEyePlot;
lbp = laneBoundaryPlotter(bep,'DisplayName','Road');
plotLaneBoundary(lbp,rbEgo1)
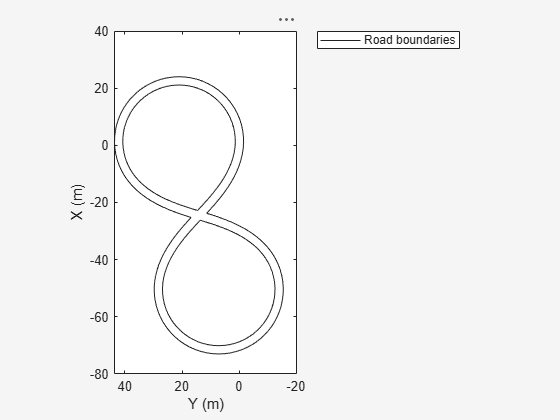
Obtain the road boundaries in world coordinates by using the roadBoundaries function. Specify the scenario as the input argument.
rbScenario = roadBoundaries(scenario);
Obtain the road boundaries in ego vehicle coordinates by using the driving.scenario.roadBoundariesToEgo function.
rbEgo2 = driving.scenario.roadBoundariesToEgo(rbScenario,ego);
Display the road boundaries on a bird's-eye plot.
bep = birdsEyePlot;
lbp = laneBoundaryPlotter(bep,'DisplayName','Road boundaries');
plotLaneBoundary(lbp,{rbEgo2})
Input Arguments
Lane boundary plotter, specified as a LaneBoundaryPlotter
object. This object is stored in the Plotters property
of a birdsEyePlot object and
configures the display of the specified lane boundaries in the bird's-eye
plot. To create this object, use the laneBoundaryPlotter
function.
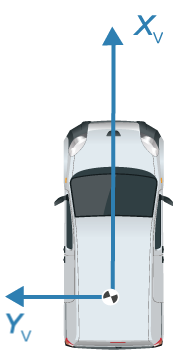
Lane boundary coordinates, specified as a cell array of M-by-2 real-valued matrices. Each matrix represents the coordinates for a different lane boundary. M is the number of coordinates in a lane boundary and can be different for each lane boundary. Each row represents the (X, Y) positions of a curve. The positive X-direction points ahead of the center of the vehicle. The positive Y-direction points to the left of the origin of the vehicle, which is the center of the rear axle, as shown in this figure of the vehicle coordinate system.
Lane boundaries, specified as a lane boundary object or an array of lane
boundary objects. Valid lane boundary objects are parabolicLaneBoundary,
cubicLaneBoundary, and clothoidLaneBoundary. If you specify an array of lane boundary
objects, all objects must be of the same type. Z-data,
which represents height, is ignored.
Version History
Introduced in R2017a