outlinePlotter
Outline plotter for bird's-eye plot
Description
olPlotter = outlinePlotter(bep)OutlinePlotter object that configures the display of object
outlines on a bird's-eye plot. The OutlinePlotter object is stored in the
Plotters property of the birdsEyePlot object, bep. To display the outlines of
actors that are in a driving scenario, first use targetOutlines to get the dimensions of the actors and barriers. Then, after
creating an outline plotter object, use the plotOutline
and
plotBarrierOutline functions to display the outlines of all the actors and
barriers in the bird's-eye plot, respectively.
olPlotter = outlinePlotter(bep,Name,Value)Name,Value pair arguments. For
example, outlinePlotter(bep,'FaceAlpha',0) sets the areas within each
outline to be fully transparent.
Examples
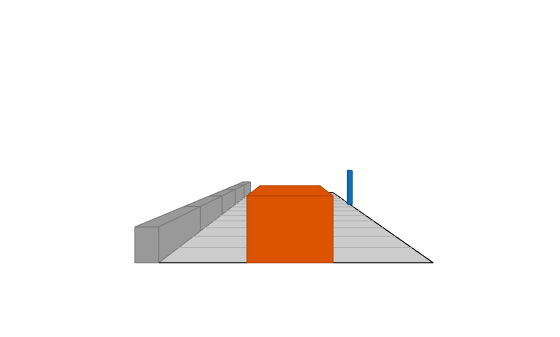
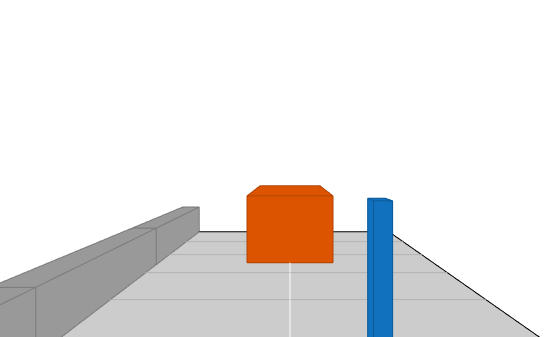
Create a driving scenario. Create a 25 m road segment with a barrier on its left edge. Add a pedestrian that crosses the road at 1 m/s, and a vehicle that drives along the road at 10 m/s.
scenario = drivingScenario;

r = road(scenario,[0 0 0; 25 0 0]);
barrier(scenario,r,'RoadEdge','left')

p = actor(scenario,'ClassID',4,'Length',0.2,'Width',0.4,'Height',1.7);
v = vehicle(scenario,'ClassID',1);

smoothTrajectory(p,[15 -3 0; 15 3 0],1)
smoothTrajectory(v,[v.RearOverhang 0 0; 25-v.Length+v.RearOverhang 0 0],10)
Use a chase plot to display the scenario from the perspective of the vehicle.
chasePlot(v,'Centerline','on')
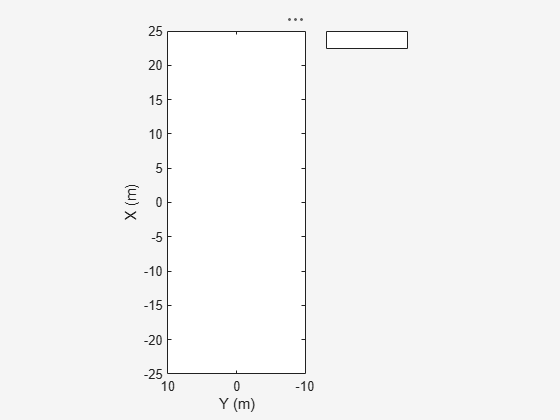
Create a bird's-eye plot, outline plotter, and lane boundary plotter.
bep = birdsEyePlot('XLim',[-25 25],'YLim',[-10 10]);
olPlotter = outlinePlotter(bep);
lbPlotter = laneBoundaryPlotter(bep);
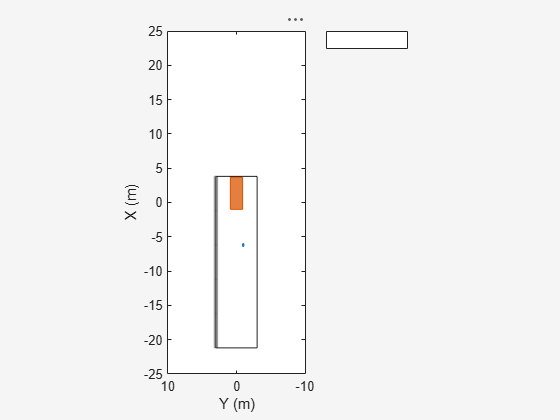
legend('off')Run the simulation loop. Update the plotter with outlines for the targets.
while advance(scenario)
   % Obtain the road boundaries and rectangular outlines.
   rb = roadBoundaries(v);
   [position,yaw,length,width,originOffset,color] = targetOutlines(v);
   [bposition,byaw,blength,bwidth,boriginOffset,bcolor,numBarrierSegments] = targetOutlines(v,'Barriers');

   % Update the bird's-eye plotters with the road, actors and barriers.
   plotLaneBoundary(lbPlotter,rb);
   plotOutline(olPlotter,position,yaw,length,width, ...
               'OriginOffset',originOffset,'Color',color);
   plotBarrierOutline(olPlotter,numBarrierSegments,bposition,byaw,blength,bwidth, ...
               'OriginOffset',boriginOffset,'Color',bcolor);
   % Allow time for plot to update.
   pause(0.01)
end
Input Arguments
Name-Value Arguments
Output Arguments
Version History
Introduced in R2017b
See Also
birdsEyePlot | plotOutline |
plotBarrierOutline | findPlotter | clearData | clearPlotterData