meshPlotter
Mesh plotter for bird's-eye plot
Description
mPlotter = meshPlotter(bep)MeshPlotter object that configures the display of meshes on a
bird's-eye plot. The MeshPlotter object is stored in the
Plotters property of the input birdsEyePlot object, bep. To display the mesh
representations of objects, use the plotMesh
function.
mPlotter = meshPlotter(bep,Name,Value)Name,Value pair arguments. For
example, meshPlotter(bep,'FaceAlpha',1) sets the mesh faces to be fully
opaque.
Examples
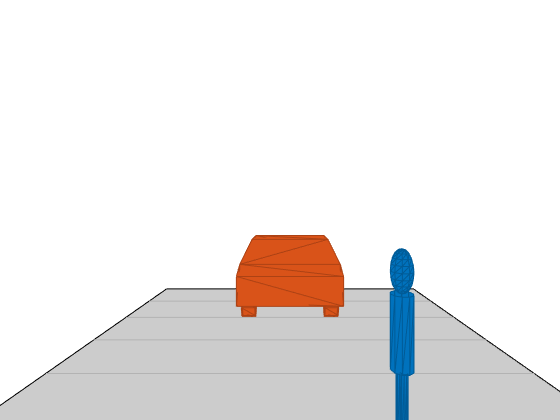
Display actors in a driving scenario by using their mesh representations instead of their cuboid representations.
Create a driving scenario, and add a 25-meter straight road to the scenario.
scenario = drivingScenario;
roadcenters = [0 0 0; 25 0 0];
road(scenario,roadcenters);
Add a pedestrian and a vehicle to the scenario. Specify the mesh dimensions of the actors using prebuilt meshes.
Specify the pedestrian mesh as a
driving.scenario.pedestrianMeshobject.Specify the vehicle mesh as a
driving.scenario.carMeshobject.
p = actor(scenario,'ClassID',4, ...
            'Length',0.2,'Width',0.4, ...
            'Height',1.7,'Mesh',driving.scenario.pedestrianMesh);

v = vehicle(scenario,'ClassID',1, ...
            'Mesh',driving.scenario.carMesh);
Add trajectories for the pedestrian and vehicle.
Specify for the pedestrian to cross the road at 1 meter per second.
Specify for the vehicle to follow the road at 10 meters per second.
waypointsP = [15 -3 0; 15 3 0];
speedP = 1;
smoothTrajectory(p,waypointsP,speedP);

wayPointsV = [v.RearOverhang 0 0; (25 - v.Length + v.RearOverhang) 0 0];
speedV = 10;
smoothTrajectory(v,wayPointsV,speedV)
Add an egocentric plot for the vehicle. Turn the display of meshes on.
chasePlot(v,'Meshes','on')
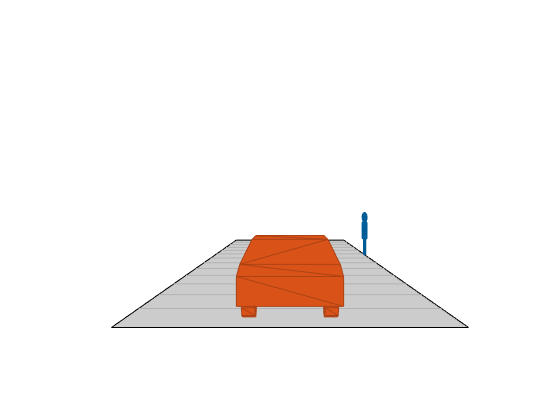
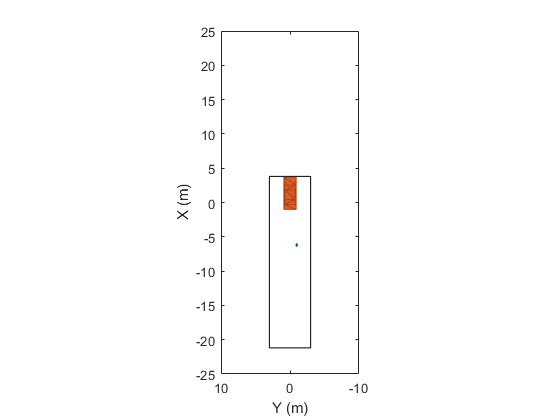
Create a bird's-eye plot in which to display the meshes. Also create a mesh plotter and lane boundary plotter. Then run the simulation loop.
Obtain the road boundaries of the road the vehicle is on.
Obtain the mesh vertices, faces, and colors of the actor meshes, with positions relative to the vehicle.
Plot the road boundaries and actor meshes on the bird's-eye plot.
Pause the scenario to allow time for the plots to update. The chase plot updates every time you advance the scenario.
bep = birdsEyePlot('XLim',[-25 25],'YLim',[-10 10]);
mPlotter = meshPlotter(bep);
lbPlotter = laneBoundaryPlotter(bep);
legend('off')

while advance(scenario)

   rb = roadBoundaries(v);

   [vertices,faces,colors] = targetMeshes(v);

   plotLaneBoundary(lbPlotter,rb)
   plotMesh(mPlotter,vertices,faces,'Color',colors)

   pause(0.01)
end
Input Arguments
Name-Value Arguments
Output Arguments
More About
In driving scenarios, a mesh is a triangle-based 3-D representation of an object. Mesh representations of objects are more detailed than the default cuboid (box-shaped) representations of objects. Meshes are useful for generating synthetic point cloud data from a driving scenario.
This table shows the difference between a cuboid representation and a mesh representation of a vehicle in a driving scenario.
| Cuboid | Mesh |
|---|---|
|
|

Version History
Introduced in R2020b
See Also
birdsEyePlot | plotMesh | clearData | clearPlotterData | targetMeshes