Compare Classification Network Architectures Using Experiment
Developing deep learning models often involves comparing multiple architectures, tuning hyperparameters, and evaluating performance. The Experiment Manager app is an interactive way to create, monitor, and analyze experiments for developing these models.
When you create a neural network, Experiment Manager can help you:
Compare different architectures or training options.
Track and visualize performance metrics.
Identify the optimal network configuration for your classification problem.
This example uses Experiment Manager to train two neural networks using three different solvers, and then evaluate the models. The networks classify images of MathWorks merchandise into five classes.
Create Experiment
Experiments and their artifacts are organized in projects, so create a new project or choose an existing project for your new experiment.
Experiment Manager supports different types of experiments for different purposes. For classification tasks, use the built-in training experiment type. Built-in training experiments train neural networks using the trainnet function and automate training and evaluating neural networks.
You can create a built-in training experiment for classification in two ways:
Start with a blank experiment. Open a blank built-in training experiment.
Use a template. For a quicker setup, you can use an experiment template. A template creates a built-in training experiment which includes some default configurations and sample functions.
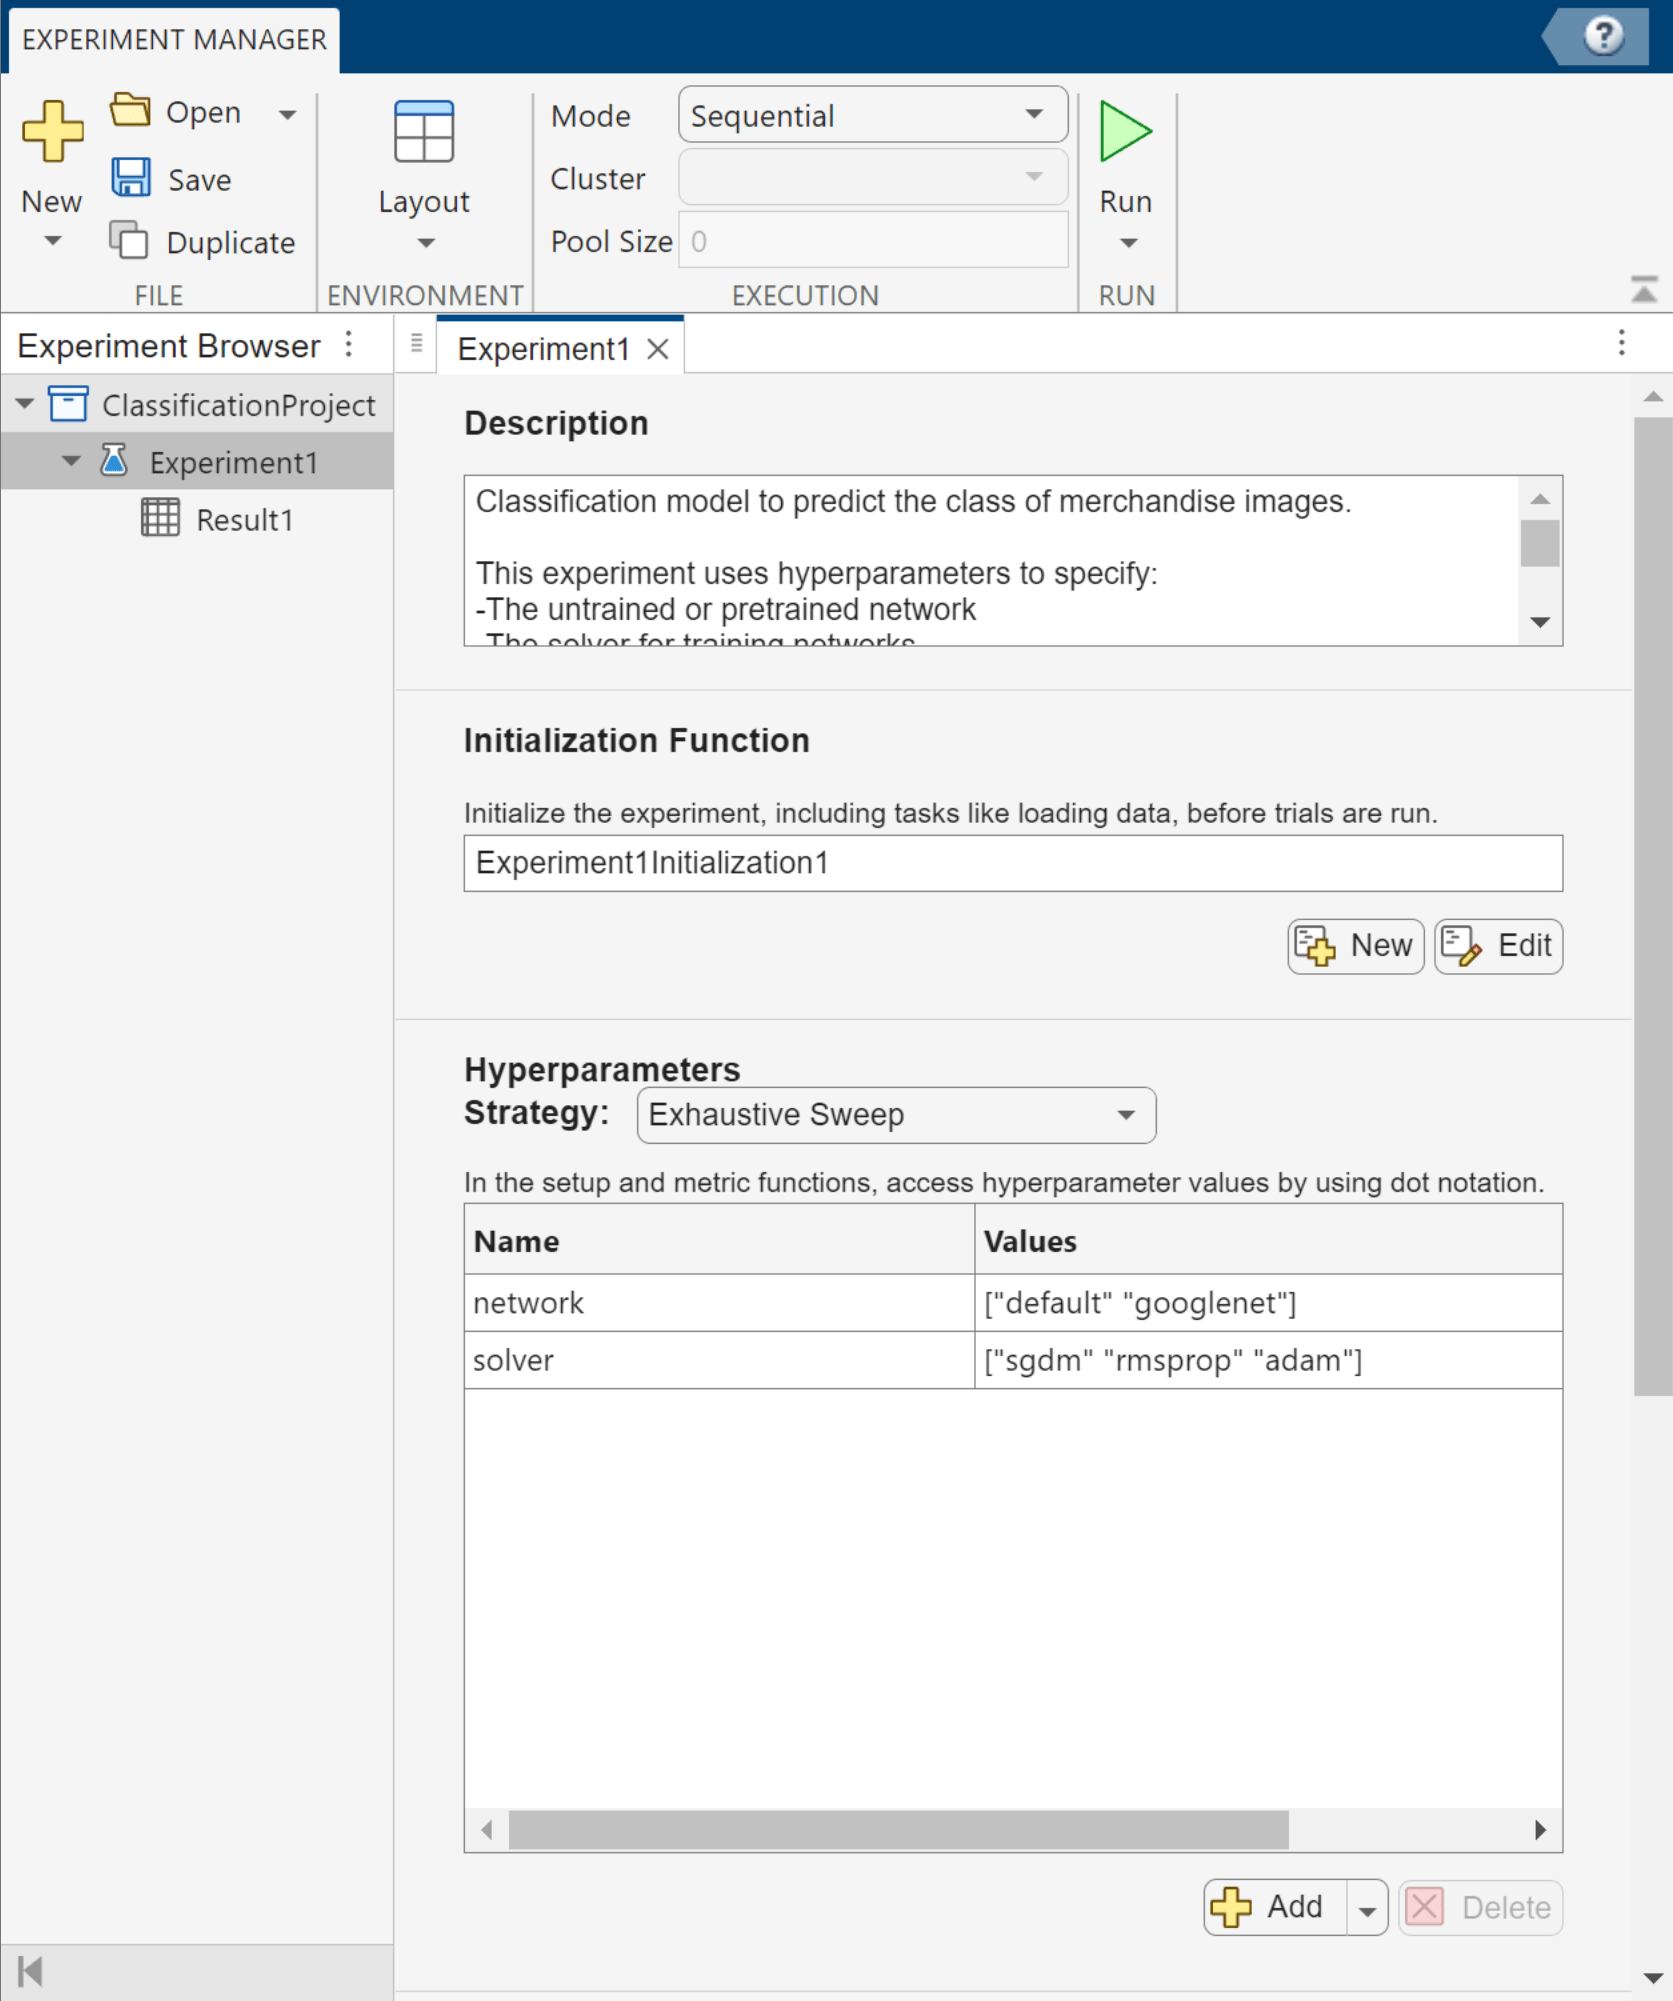
For this example, select the Image Classification by Sweeping Hyperparameters template. The experiment editor displays the experiment configuration details, which you can review and edit.
Write Experiment Description
Use the Description section of the experiment editor to document the purpose and details of your experiment. For classification experiments, consider including a summary of the classification problem, your data set, any data-preprocessing steps, the architecture details, the hyperparameters you want to optimize, and the metrics you will use to evaluate the result.
For this experiment, which compares networks that classify images into types of merchandise, enter this description:
This classification model predicts the class of merchandise images.

This experiment uses hyperparameters to specify:
-The untrained or pretrained network
-The solver for training networks

The model is trained using the trainnet function, and its performance is measured using the training and validation loss.
Configure Initialization Function
The Initialization Function section of the experiment editor specifies a function that runs once before the experiment trials begin. This function is optional, but it is useful for performing setup tasks that are shared across all trials in your experiment, rather than running redundant code for each trial. For a classification experiment, an initialization function can load, preprocess, partition, or format your training and validation data.
You can create an initialization function by clicking New in the Initialization Function section of the experiment editor, or if one already exists for your experiment template, click Edit. The initialization function does not accept any input arguments. The function returns a scalar structure containing the variables you want to share with the rest of the experiment.
For example, to define an initialization function for this classification experiment, edit the initialization function included with the experiment template. In the function, define the training and validation data for the experiment, and return the experiment data as a scalar structure output, which you can access in the setup function.
function output = Experiment1Initialization1
filename = "MerchData.zip";
dataFolder = fullfile(tempdir,"MerchData");
unzip(filename,tempdir);

images = imageDatastore(dataFolder, ...
    IncludeSubfolders=true, ...
    LabelSource="foldernames");

numTrainingFiles = 0.7;
[output.imagesTrain,output.imagesValidation] = splitEachLabel(images,numTrainingFiles);
end
Specify Hyperparameters
In the Hyperparameters section, you can define which network you want to explore or which training parameters you want to optimize during your experiment. In the table, specify the hyperparameters and their possible values.
When you run the experiment, if the Exhaustive Sweep strategy is selected, Experiment Manager trains the network using every combination of the specified hyperparameter values. If you have Statistics and Machine Learning Toolbox™, you can access additional strategies for optimizing hyperparameters. For more information, see Choose Strategy for Exploring Experiment Parameters.
For each experiment trial, the hyperparameter values are stored as fields in a structure named params, which you will access in the setup function. The experiment template might include some default hyperparameters to help you get started. For some templates, you can also access suggested hyperparameters.
For this example, remove the default hyperparameter. Then, add the hyperparameters network and solver, and specify their values as string arrays.
Name | Values |
|---|---|
|
|
|
|
You can edit the table of hyperparameters for future experiment runs. So, you might want to start with a subset of values to explore the parameter space and then add more solvers or other hyperparameters based on the results to improve the network.
Configure Setup Function
The Setup Function section specifies a function that runs once for each experiment trial. The setup function defines the configuration for each individual trial. This function is called once per trial, and it prepares everything that is needed to train and evaluate the network using the trainnet function.
Use the setup function to:
Construct your neural network architecture for the current trial.
Specify training options and hyperparameters.
Prepare the data for training and validation.
Return all required inputs for the
trainnetfunction.
The setup function does not run the training function trainnet. Instead, the setup function returns outputs that are automatically passed as inputs to the trainnet function when Experiment Manager executes the trial using the syntax netTrained = trainnet(imagesTrain,net,lossFcn,options). The setup function connects your experiment configuration, including the hyperparameters and data, and the training process.
For this classification experiment, configure the setup function to:
Access the hyperparameter values for the current trial using the
paramsstructure.Retrieve any data prepared by the initialization function using the
InitializationFunctionOutputfield of theparamsstructure.Specify the training and validation data.
Define the network architecture.
Use cross-entropy loss as the loss function.
Define training options.
In the Setup Function section, click Edit. Then, customize the setup function template.
function [imagesTrain,net,lossFcn,options] = Experiment1_setup1(params)
data = params.InitializationFunctionOutput;
imagesTrain = data.imagesTrain;
imagesValidation = data.imagesValidation;
numClasses = 5;

switch params.network
    case "default"
        inputSize = [227 227 3];
        net = [
            imageInputLayer(inputSize)
            convolution2dLayer(5,20)
            batchNormalizationLayer
            reluLayer
            fullyConnectedLayer(numClasses)
            softmaxLayer];
    case "googlenet"
        net = imagePretrainedNetwork("googlenet",NumClasses=numClasses);
    otherwise
        error("Undefined network selection.");
end

lossFcn = "crossentropy";

options = trainingOptions(params.solver, ...
    MiniBatchSize=10, ...
    MaxEpochs=8, ...
    InitialLearnRate=1e-4, ...
    Shuffle="every-epoch", ...
    ValidationData=imagesValidation, ...
    ValidationFrequency=5, ...
    Verbose=false, ...
    Metrics="accuracy");
end
Run Experiment
Once you have configured an experiment, in Experiment Manager, click Run. For each trial, Experiment Manager:
Runs the initialization function once (if defined)
Runs the setup function to configure the network, data, loss, and training options for the current hyperparameter combination
Trains the network using the
trainnetfunction and generates a training plotEvaluates any custom post-training metrics (if specified)
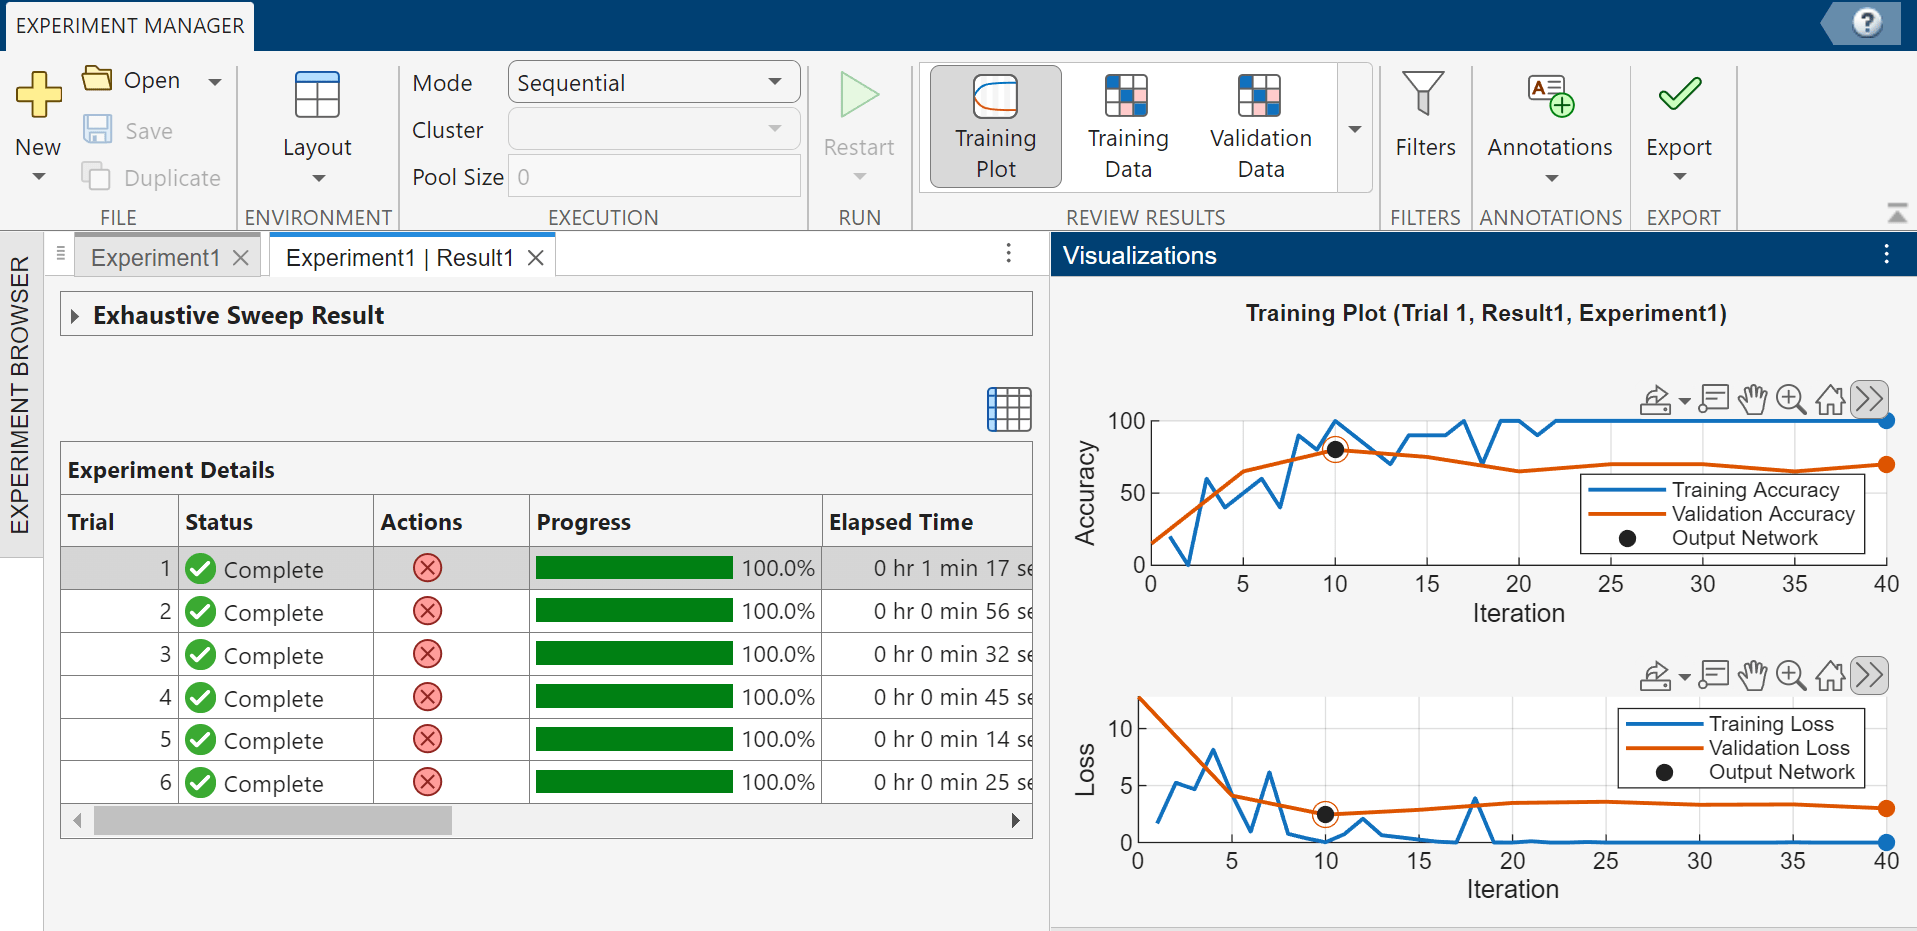
For this classification experiment, which uses the exhaustive sweep strategy for hyperparameters, Experiment Manager runs six trials to produce results for the two networks and three solvers.
To monitor the status of training, select a trial in the table of results, and in the Review Results section of the toolstrip, click Training Plot. In the Visualizations panel that appears, plots display the training and validation accuracy and loss for the completed iterations of the selected trial. The table also displays the training and validation accuracy and loss for the trial. You can show or hide columns by clicking the ![]() button above the table.
button above the table.
By default, Experiment Manager runs one trial at a time. For information about running multiple trials at the same time or offloading your experiment as a batch job in a cluster, see Run Experiments in Parallel and Offload Experiments as Batch Jobs to a Cluster.
Evaluate Results
After running your experiment, you can use the table of results to identify and analyze the best-performing networks. For example, you can:
Find the trial with the lowest validation loss. Sort the results table by hovering over the ValidationLoss column header and clicking the sort icon.
Visualize your results. In the Experiment Manager toolstrip, select a plot from the Review Results gallery.
Annotate your findings. Select and right-click a cell in the results table, and select Add Annotation.
Export a network to analyze in the MATLAB workspace. Select a trial in the results table and click Export > Trained Network on the toolstrip.
For example, display a confusion matrix for a trial to evaluate the quality of the network. Select a trial, and in the Review Results section of the toolstrip, click Validation Data.
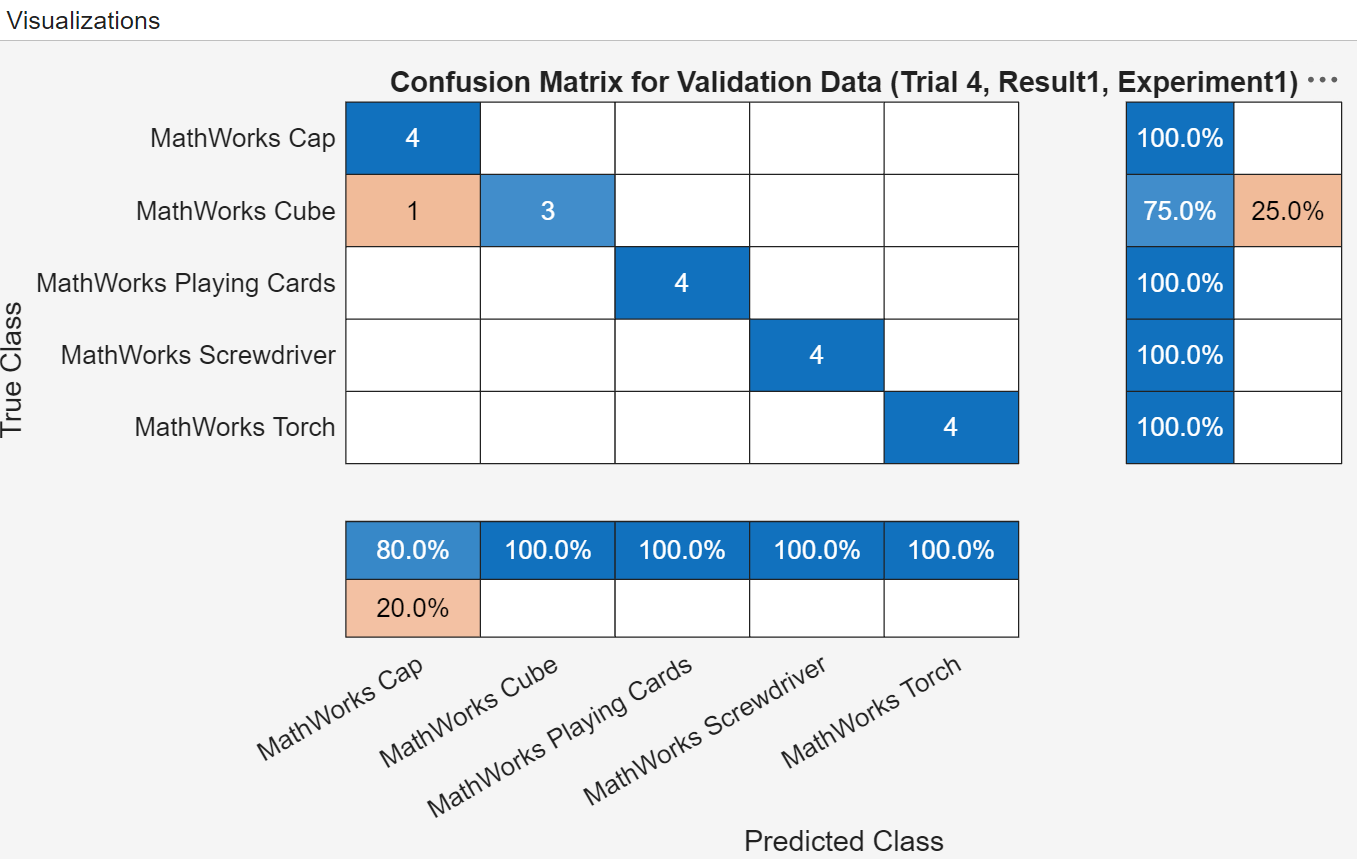
If you decide to use validation loss and validation accuracy as the metrics to evaluate the different model configurations, you can sort the table of results using the corresponding metrics columns to identify the most favorable model. Because Trial 4 showed the lowest validation loss and highest validation accuracy, you might conclude that the googlenet network with the rmsprop solver creates the most favorable classification model for this merchandise image classification problem.