Analyze H-Notch Unit Element
This step of the tutorial shows how to perform vector and scalar frequency analysis on a 1-by-2 H-notch linear array.
In the Analysis tab, set the Center Frequency to 4.65 GHz and Frequency Range to 4:0.1:5 GHz. 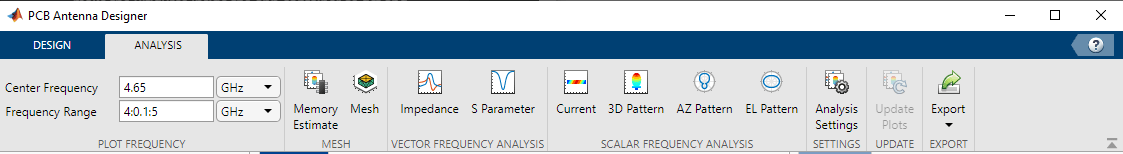
Memory Estimate
Click the Memory Estimate button from the Mesh section to estimate the memory you will require to run the analysis.
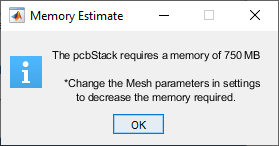
You will need a memory of 750 MB (RAM) to analyze the antenna design. You can alter the memory requirements by changing the mesh parameters. Select Mesh on the toolbar to alter the mesh settings.
Analysis Settings
Click Analysis Settings from the Analysis section on the toolbar to set the plot and mesh parameters to the following:
Ref Impedance(Z0) —
50ohmsAz Range —
0:5:360degEl Range —
0:5:360degMeshing Mode —
auto

Click OK to save the settings.
Run Analysis
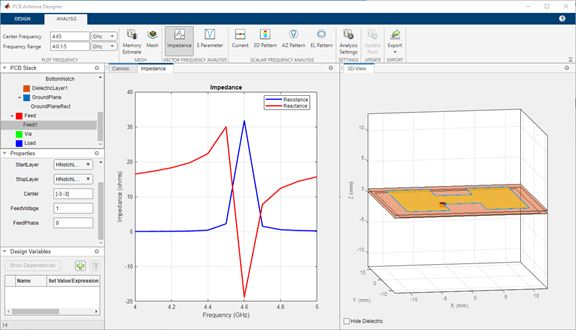
Select Impedance from the Vector Frequency Analysis section on the toolbar to plot the impedance plot. The impedance plot shows that the PCB stack antenna resonates at 4.6 GHz.
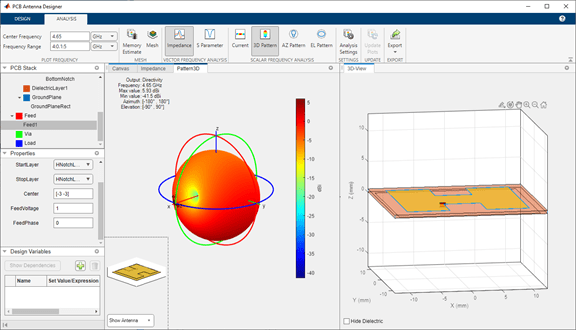
Click 3D Pattern from the Scalar Frequency Analysis section on the toolbar to plot the 3-D far-field radiation pattern of the antenna. The directivity of the H-notch patch unit element is 5.93 dBi.
Update Plots
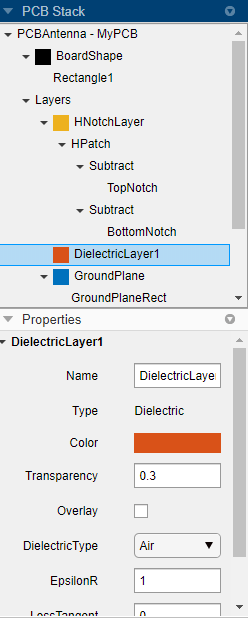
Select DielectricLayer1 from the PCB Stack navigation tree and set the DielectricType to TMM10i in the Properties pane.

Click Update Plots from the Update section on the Analysis tab to update the analysis results. The impedance plot now shows that the PCB stack antenna resonates at 4.4 GHz.
