
Volume slice visualization gui
GUI for manipulating slices and isosurfaces over a volume.Control over color transparency, contours, and rendering techniques via menus.Original sliceomatic 1.0 for older versions of MATLAB is in the
- 39.5K (All time)
- 4 (Last 30 days)
- 4.4 / 5
- Community
-
1 Sep 2016
3D volume viz with interactive slice selection, colored ortho-planes, windowing, colormap selection.
This tool provides an interactive 3D volume visualization. The function accepts as arguments any 3D matrix (of type double or uint8) and optional colormap, and displays a 2x2 figure of the 3
- 7.2K (All time)
- 1 (Last 30 days)
- 4.6 / 5
- Community
-
23 Apr 2013

Scripts for Volume Visualization Videos
Source code files which go with the series of videos on volume visualization from Doug's Blog.
These are the source code files which generate the figures displayed in the volume visualization video series recently presented on Doug's Blog. These files are divided into cells which roughly
- 1.1K (All time)
- 1 (Last 30 days)
- 5.0 / 5
- Community
-
1 Sep 2016
Voxelized volume visualization for 3D and 3D RGB arrays
VOXview is an easy-to-use function for visualizing small 3D scalar or RGB (i.e. MxNxO x3) arrays. This function was specifically designed to give the user independent control of voxel alpha
- 550 (All time)
- 4 (Last 30 days)
- 5.0 / 5
- Community
-
26 Mar 2021

Visualization of multi-modal volume segmentation
Visualize single- or multi-modal 2D or 3D images and corresponding segmentation
It can visualize single- or multi-modal 2D or 3D images in a selected plane, which can be switched.Modalities are switched by left slider, slices are changed by botom slider. Planes are switched by
- 1.8K (All time)
- 2 (Last 30 days)
- 5.0 / 5
- Community
-
29 Nov 2014

4D (3D+1) volume visualization with windowing, custom colormaps, and component selection
A tool for visualizing vector-valued volumetric data, which has become more common recently in medical imaging (e.g., 3D + time, multi-modal acquisition). The function accepts a 4D matrix, allowing
- 2.4K (All time)
- 2 (Last 30 days)
- 3.5 / 5
- Community
-
23 Apr 2013

MIP, Color, Slice and Shaded 3D (shearwarp) Volume Rendering, interactive 3D view/measurement GUI
Maximum intensity projections (MIP), Volume Rendering (VR) , Slice render, and colored and Phong shaded Volume rendering.Voxel opacity and color tables can be changed on the fly allowing also iso surface
- 56.9K (All time)
- 16 (Last 30 days)
- 4.8 / 5
- Community
-
15 Sep 2016

3D Quiver with volumized arrows
Produce a 3D quiver of arrows with many visualization options
This quiver3D differs from the basic quiver3 in that it allows far more options for visualization. Based on the 'surf' command, you can produce color-based visuals of your data via the multiple
- 4K (All time)
- 4 (Last 30 days)
- 5.0 / 5
- Community
-
18 Sep 2006

GUI to open most Medical file-formats: Dicom, V3D, ISI, NifTI, Analyze and other formats
Lab ( .gipl ) HDR/IMG Analyze ( .hdr ) ISI Files ( .isi ) NifTi ( .nii ) RAW files ( .raw , .* ) VMP BrainVoyager ( .vmp ) XIF HDllab/ATL ultrasound ( .xif ) VTK Visualization
- 32.7K (All time)
- 19 (Last 30 days)
- 4.2 / 5
- Community
-
23 Feb 2011
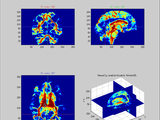
GUI for visualization of data volumes via slices, contour lines, isosurfaces, and animation.
This is release 1.03 of the Volume Browser, a simplified version of the 3-D volume viewer "V3D" written by Robert Barsch and available from the Matlab File Exchange, File ID 2255.If you already have
- 8.8K (All time)
- 2 (Last 30 days)
- 4.6 / 5
- Community
-
18 Nov 2009

InSPIRE utility to calculate DICE Coefficient
This programs calculate and visualize the dice similarity (volume overlap) of 2D binary images.
- 2K (All time)
- 1 (Last 30 days)
- 5.0 / 5
- Community
-
23 Apr 2012

GUI for Visualizing 3D Volumetric Data
This is a GUI for visualizing volume data. Includes rendering volumes, displaying isosurfaces.
Includes different types of visualization of three-dimensional array (volumetric data):1. Orthogonal slices - each slice individually, as well as three orthogonal slices on one plot2. Rendered volume
- 9.5K (All time)
- 1 (Last 30 days)
- 3.6 / 5
- Community
-
11 Jul 2007

An app for the easy visualization of volume data ( 4D )
This is an interactive tool that helps with volume data visualization such as during the studies of fluid flow, electrical or electro magnetic fields etc. It contains its own built-in help.Data can
- 220 (All time)
- 1 (Last 30 days)
- 5.0 / 5
- Community
-
20 Jan 2021

Core tools required for running Canlab Matlab toolboxes. The heart of this toolbox is object-oriented tools that enable interactive analysis
- 474 (All time)
- 3 (Last 30 days)
- -- / 5
- Community
-
16 Aug 2024

Zeffiro Forward and Inverse Interface for Complex Geometries
Interface for using finite elements in inverse problems with complex domains
- 647 (All time)
- 1 (Last 30 days)
- 5.0 / 5
- Community
-
11 Aug 2024

Yet Another Color Gamut Visualizer
This tool helps to visualizes color volume by constructing a 3D gamut(s) given point cloud of color values.
This tool helps to visualizes color volume by constructing a 3D gamut(s) given point cloud of color values.Please visit GitHub page (https://github.com/QiuJueqin/Yet-Another-Color-Gamut-Visualizer
- 155 (All time)
- 1 (Last 30 days)
- 5.0 / 5
- Community
-
31 May 2019

JuGEx - Julich-Brain Gene Expression
Cytoarchitecture linked to gene expression to study multilevel human brain organization
user-defined candidate gene list between two user-defined volumes of interest (Julich-Brain maps or other volume of interest in MNI152 reference space [3]). The tool downloads expression values via the Allen
- 25 (All time)
- 2 (Last 30 days)
- -- / 5
- Community
-
20 Apr 2023

inpolyhedron - are points inside a triangulated volume?
Test if 3d points are inside a mesh. Or, voxelise a mask from a surface. Mesh can be non-convex too!
gridded query points rather than an N-by-3 array of points. X, Y, and Z coordinates of the grid supplied in XVEC, YVEC, and ZVEC respectively. IN will return as a 3D logical volume with SIZE(IN) =
- 8.9K (All time)
- 44 (Last 30 days)
- 4.8 / 5
- Community
-
12 Nov 2015

SoundVolume - set or get the system speaker sound volume
SoundVolume sets or gets the computer system's speaker sound volume, using Java
SoundVolume sets or gets the computer's system speaker sound volume Syntax: volume = SoundVolume(volume); SoundVolume(volume) sets the system speaker sound volume. The volume value should be
- 4K (All time)
- 1 (Last 30 days)
- 5.0 / 5
- Community
-
9 May 2014

Minimum Volume Enclosing Ellipsoid
Computes the minimum-volume covering ellipoid that encloses N points in a D-dimensional space.
[A , c] = MinVolEllipse(P, tolerance)Finds the minimum volume enclosing ellipsoid (MVEE) of a set of data points stored in matrix P. The following optimization problem is solved: minimize
- 10.9K (All time)
- 8 (Last 30 days)
- 4.9 / 5
- Community
-
20 Jan 2009

Volume Visualization and slicing
(translations and rotations) through a friendly user interface. It also visualizes the loaded volumes with planes indicates the slices positions and orientations with respect to the volume.Multiple slices can
- 670 (All time)
- 1 (Last 30 days)
- -- / 5
- Community
-
24 Mar 2017
This is to visualize the functions of 3 variables: z=f(x,y,t), which becomes 4 dimensional problem
This is to visualize the functions of 3 independent variables ( v=f(x,y,z) ), which becomes 4 dimensional problem.It just uses the MATLAB function "slice", in an effective way, leading to
- 7.6K (All time)
- 1 (Last 30 days)
- 3.6 / 5
- Community
-
25 Feb 2010

3-d volume (voxel) rendering
- 21.4K (All time)
- 15 (Last 30 days)
- 4.8 / 5
- Community
-
24 May 2018
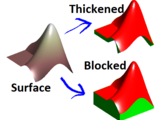
surf2solid - make a solid volume from a surface for 3D printing
Turns thin surfaces into closed solids by adding a flat base or offsetting by a given thickness.
specify the X and Y spacing between grid points. SURF2SOLID(...,'PropertyName',VALUE,...) makes a solid volume from thin surface using any of the following property/value options: ELEVATION - Extends
- 9.3K (All time)
- 15 (Last 30 days)
- 4.8 / 5
- Community
-
10 Feb 2014

ASL Viewer visualize peak time map from 4D volume data (time-sequential 3D) of ASL (arterial spin labeling).
- 76 (All time)
- 2 (Last 30 days)
- -- / 5
- Community
-
27 Apr 2021

Volume Render GUI with mouse change able color and alpha maps
This is a Fast Volume Render application, using OpenGL surfaces. Color and alpha maps can be changed on the fly by dragging and creating markers in a histogram with the mouse.Note:There is a bug /
- 6.3K (All time)
- 4 (Last 30 days)
- 4.8 / 5
- Community
-
11 Mar 2008

stlwrite - write ASCII or Binary STL files
Export a variety of inputs (patch, surface) to an STL triangular mesh
volume tmpvol(8:12,8:12,5:15) = 1; % Turn some voxels on fv = isosurface(~tmpvol, 0.5); % Make patch w. faces "out" stlwrite('test.stl',fv) % Save to binary .stl Example 2
- 30.5K (All time)
- 38 (Last 30 days)
- 4.9 / 5
- Community
-
4 May 2018
Volume of a surface triangulation
Given a surface triangulation, compute the volume enclosed using divergence theorem.
Given a surface triangulation, compute the volume enclosed using divergence theorem. Assumption:Triangle nodes are ordered correctly, i.e.,computed normal is outwardsInput: p: (3xnPoints), t
- 3.2K (All time)
- 3 (Last 30 days)
- 3.9 / 5
- Community
-
17 Mar 2010

vtkwrite : Exports various 2D/3D data to ParaView in VTK file format
Exports 2D/3D image volume, vector field, surface, lines, polygons, etc. to ParaView
Paraview is a powerful open-source software for visualization of large 3D dataset. It offers more options, details and much better performance than built-in Matlab 3D visualization modules. This
- 12.2K (All time)
- 28 (Last 30 days)
- 4.9 / 5
- Community
-
3 Oct 2016
Image to Volume Conversion for Representing Materials Topography
Converts a single image (microscopy, topogrpahy) into array of images.
Function for creating a volume (array of images) representing topography from a single image.topog=im2topography(afm_im,N,A);N - number of depths levels to describe. The larger N - more slices
- 3.8K (All time)
- 1 (Last 30 days)
- 5.0 / 5
- Community
-
17 Nov 2003

Solving shallow water equations using finite volume methods
Two dimensional (2D) conservative shallow water equations solved using a finite volume method
- 2.2K (All time)
- 3 (Last 30 days)
- 5.0 / 5
- Community
-
3 Jul 2014

3D visualization of density distribution
Volumetric visualization of bone (or other tissue) density distribution from DICOM
(like bone)- Tridimensional smooth of the volume- Visualization of the data in 3D view
- 1.1K (All time)
- 1 (Last 30 days)
- 5.0 / 5
- Community
-
19 Mar 2014

The function VISLABELS is used to visualize the output of BWLABEL.
VISLABELS is used to visualize the output of BWLABEL. VISLABELS(L), where L is a label matrix returned by BWLABEL, displays each object's label number on top of the object itself. Note: VISLABELS
- 7.1K (All time)
- 3 (Last 30 days)
- 4.7 / 5
- Community
-
1 Sep 2016

3D Volumetric fMRI visualization
visualizations of brain imaging data. Volumetric easily allows layering and displaying multiple channels of data. It features Volumetric rendering which allows for transparent solids that change color and
- 2.6K (All time)
- 2 (Last 30 days)
- 5.0 / 5
- Community
-
6 Mar 2020

Volume Labeling Widgets - MATLAB App Building Components
Enable custom workflows for labeling volumes and isosurfaces in your MATLAB app.
app.https://www.mathworks.com/help/images/ref/volumeviewer-app.htmlWidgets provided in this toolbox include:Image Stack / Volume Visualization and Annotation LabelingIsosurface Visualization and Annotation LabelingSlice Plane (X/Y/Z) visualizationAdditionally included are
- 393 (All time)
- 2 (Last 30 days)
- 5.0 / 5
- Community
-
10 Apr 2025

Plot a 3D matrix as a semitransparent volume
Note: This function does not yet work for Matlab 2014b or later. This function plots a 3D data volume as color-scaled semitransparent surface planes in each
- 3.6K (All time)
- 3 (Last 30 days)
- 4.2 / 5
- Community
-
12 Mar 2015
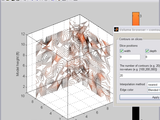
Volume explorer tool by 3 orthogonal slices
Orthogonalslicer creates 3 figures showing the 3 orthogonal slices from a scalar volume of data. Cross lines on each image represents lines of intersection of the appropriate plane and the two other
- 5.5K (All time)
- 1 (Last 30 days)
- 5.0 / 5
- Community
-
27 Jun 2005

gramm data visualization toolbox
gramm is a powerful and full-featured plotting and visualization toolbox similar to ggplot2 or seaborn
Exchange](https://www.mathworks.com/matlabcentral/images/matlab-file-exchange.svg)](https://mathworks.com/matlabcentral/fileexchange/54465-gramm-data-visualization-toolbox)Gramm is a MATLAB toolbox that enables the rapid creation of complex, publication-quality figures. Its design philosophy focuses on a *declarative* approach, where users specify the desired end result, as
- 14.6K (All time)
- 29 (Last 30 days)
- 5.0 / 5
- Community
-
8 Apr 2026

Analytical intersection volume between two spheres
Compute the overlap volume between 2 spheres defined in an array
Compute the overlap volume between 2 spheres defined in an array.Computation is vectorized, and intersection volume are computed ananalytical way.Input: spheres data presented in an array G of four
- 2.5K (All time)
- 1 (Last 30 days)
- 3.7 / 5
- Community
-
10 Sep 2009
Transform a 3d volume by using an affine transformation matrix
This function transforms a volume by using an affine transformation matrix.
This function transforms volume 'old_im' by means of affine transformation matrix 'M'. The output volume can be sub- and oversampled. The function makes use of interp3, so 'nearest', 'linear
- 1.9K (All time)
- 1 (Last 30 days)
- 5.0 / 5
- Community
-
17 Oct 2009

Volume rendering app in MATLAB to visualize gray scale and labeled volume data.
Checkout the README of the project on GitLab: https://gitlab.com/tim.vandelooverbosch/volume_rendering_appFeatures:Simultaneous volume rendering of both gray scale and labeled volume dataLabeled data
- -- / 5
- Community
-
18 Jun 2019

Visualizing Phasors, an Animated GUI
A tool for visualizing phasor (voltage, current, impedance), along with animation.
- 10K (All time)
- 9 (Last 30 days)
- 4.5 / 5
- Community
-
20 May 2003

Create a wind visualization
This is an example of how to create wind flow visualization in MATLAB®.Read about the "isosurface", "isonormals", "isocaps", "coneplot", "streamline", "patch", and "reducepatch" functions in the
- 3.5K (All time)
- 2 (Last 30 days)
- 5.0 / 5
- Community
-
19 Dec 2018

- 8.7K (All time)
- 1 (Last 30 days)
- 4.9 / 5
- Community
-
24 Oct 2005

Compute volume and area of triangulation using divergence theorem of Gauss
Computes the VOLUME and AREA of a closed surface defined by the triangulation in indices TRI and coordinates X, Y and Z, using the divergence theorem of Gauss (volume/surface integral). The unit of
- 2.2K (All time)
- 1 (Last 30 days)
- 2.8 / 5
- Community
-
5 Sep 2007

A Simple Finite Volume Solver for Matlab
A simple yet general purpose FVM solver for transient convection diffusion PDE
FVTool: Finite volume toolbox for MatlabTiny Documents 📘.FVTool in:Python: PyFVToolJulia: JFVM.jlFVToolThis is a finite volume (toy) toolbox for chemical/petroleum engineers.Right now, it can solve
- 12.5K (All time)
- 12 (Last 30 days)
- 5.0 / 5
- Community
-
4 Jul 2023

affineSpaceIntersection - Intersection of lines/planes/volumes/etc.
Compute intersections of lines, planes, volumes, etc. in arbitrary dimensions.
- 346 (All time)
- 1 (Last 30 days)
- 5.0 / 5
- Community
-
23 Mar 2015

App for exploring higher dimensional data using volumetric visualizations and animation.
This app provides an interactive environment to explore four and five dimensional data using some of MATLAB's abilities for volumetric visualization and animation. It was originally designed for data
- 6.8K (All time)
- 2 (Last 30 days)
- 4.9 / 5
- Community
-
1 Sep 2016

Augmented Lagrangian Digital Volume Correlation (ALDVC)
Adaptive Lagrangian Digital Volume Correlation - volumetric displacement and strain measurement based on a hybrid local-global approach
Augmented Lagrangian Digital Volume Correlation (ALDVC): volumetric displacement and strain measurement based on a hybrid local-global approach. ALDVC is a fast, parallel-computing hybrid DVC
- 2K (All time)
- 1 (Last 30 days)
- 5.0 / 5
- Community
-
9 Mar 2024

Volume of a (hyper)sphere, sphere cap, or any band through a sphere defined by two parallel planes
This tool computes the volume inside a sphere in n dimensions, or inside a sphere cap, or inside any part of a sphere that can be defined by two parallel slicing planes. Compute the volume of a unit
- 2.7K (All time)
- 1 (Last 30 days)
- 4.7 / 5
- Community
-
1 Sep 2010

Flow Cytometry Data Reader and Visualization
Flow Cytometry Data Reader and Visualization Example
This includes a function to read in the standard flow cytometry FCS format data and examples of how to visualize the data.
- 12.2K (All time)
- 12 (Last 30 days)
- 4.4 / 5
- Community
-
1 Sep 2016

opensoundcontrol - Open Volume Control for Windows
Open Volume Controdoes open in Windows the volume control.
>> opensoundcontrol does check if the machine is running Windows and opens the Windows Volume Control Dialog. It's an easy way to open the Volume control to modify the loudness of Windows Sound
- 3.4K (All time)
- 1 (Last 30 days)
- 5.0 / 5
- Community
-
30 Nov 2004
Dicom directory (of slices) to 3D volume image
Read a series of dicom slice images to a 3D volume image and meta data.
This function reads all good dicom files in a given directory and outputs a volume image. The slices are sorted by the SliceLocation tag in the image header. If no directory is specified, it opens
- 10.3K (All time)
- 1 (Last 30 days)
- 3.8 / 5
- Community
-
7 Apr 2009

Intensity normalization of Brain volume
Intensity normalization of Brain volume given a reference volume
This software adjust the intensity levels of a NIfti file containing a brain according to a reference volume.The two algorithms are based on Nyul et al. 2007 and Hellier 2009.It contains a nifti
- 1.6K (All time)
- 1 (Last 30 days)
- 5.0 / 5
- Community
-
27 Jan 2014

Finite Volume Methods 1D - educational
Educational GUI to learn about Finite Volume Methods in 1D (linear and non-linear equations)
FVM 1DEducational graphical user interface (GUI), developed in Matlab R2018a, to learn about Finite Volume Methods in 1D (linear and non-linear equations).Additionally, I have included the report
- 483 (All time)
- 2 (Last 30 days)
- 5.0 / 5
- Community
-
3 Aug 2022

Compressibility factor, Molar Volume and Pressure EOS Solver
Programs that solve the compressibility factor (by MOSS iteration) and molar volume, and pressure of a substance at the given state
(iterative) approach. Then the molar volume is solved. The second program solves for the pressure. The input data required for the 1st program are Pressure, Temperature, Critical Pressure and Temperature (if
- 620 (All time)
- 4 (Last 30 days)
- 4.9 / 5
- Community
-
19 Jul 2020

ExtractSlice extracts an arbitrary slice, both intensities and indices, from a given volume.
ExtractSlice extracts an arbitrary slice, both intensities and indices, from the input volume given the center and normal of the slice. If you are familiar with IDL, this is the equivalent function
- 2K (All time)
- 1 (Last 30 days)
- 4.5 / 5
- Community
-
12 Aug 2011

Visualizing a hyper-plane in SVM classifier(SVMの分離境界面の可視化)
A hyper-plane in SVM classifier was visualized. 3変数にてSVMを使い、分類を行うときの分離曲面を可視化します。
- 534 (All time)
- 6 (Last 30 days)
- 5.0 / 5
- Community
-
12 Apr 2020

Renders a 3D volume according to a intensity indexed color map and opacity map via ray tracing.
This is a demo to use a c/mex volume renderer. The 3D volume is rendered by a ray tracing algorithm.
- 1.5K (All time)
- 1 (Last 30 days)
- 5.0 / 5
- Community
-
3 Jul 2012

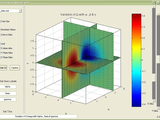
Displays 3 orthogonal slices from a 3D volume with optional overlay.
overlayVolume interactively shows three orthogonal slices from a 3D volume, with optional overlay. Display ranges, colormaps, transparency and the pixelsize can be changed.Volumes of interest can be
- 1.1K (All time)
- 1 (Last 30 days)
- 5.0 / 5
- Community
-
5 Jul 2017