4,769 results
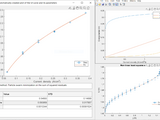
Water electrolysis modelling toolbox for UI curve parametrization

Easily label pushbuttons with (rotated, vertical, or multi-line) text.
buttonIcon = createButtonLabel(string,PVs,figOpt)Have you ever been frustrated by an inability to label a vertically oriented pushbutton or uicontrol with a string? This function is for you!All valid
Plot 2D/3D of vectors, planes, lines, spheres, and... display matrix equations.
. drawPlane.m - Draw 2D/3D plane.3. drawSpan.m - Draw line(2D)/plane(3D) spanned by one (2D/3D) or two (3D) vectors.4. drawLine.m - Draw 2D/3D line between two points.5. drawXLine.m - Draw vertical

3-D Ray Trace function for refractive propagation

A collection of functions for 2D and 3D geometric computing (intersections, distance...) on various shapes: polygons, meshes, ellipsoids...

Plots vertical lines at points defined on the x-axis.
plot_lines(xin) - Plots vertical lines at points defined on the x-axis using red solid lines and the current y-axis limits using a single line handleplot_lines(xin,[a b]) - Plots the lines from a to

Adds vertical lines to the current plot.
Adds vertical lines to the current plot. The lines extend to the current y-axis limits.

errorbar plot for log y scale
ERRORBARLOGY Show the vertical errorbar line in log y scale plot when the data error is larger than data itself.Matlab buidin ERRORBAR does not plot the vertical errobar line in a log y scale plot
Vertical Line in Matlab
vr(xPos) plot a vertical line at xPos getting current axis values with default color gray, line width 1, and a solid line with no markers.However, vr(xPos,varargin) plot a vertical line at xPos
Librería de análisis estructural matricial en MATLAB
3-D Propagation simulator for turbulent media

A library for scintillation channel modeling applications.

Simulate Propagation in 2-D
MATLAB scripts for EEG/eye position data analysis

Plot a horizontal or vertical line that spans the current axes.
Plots a horizontal or vertical line that spans the current axes. Accepts formatting specifications like the plot function. Will overwrite existing plots unless "hold on" is called.

Shows y-values of time series in 2D plots by clicking on the axes.
. By clicking repeatedly on different x positions, the labels and reference line come and go.After clicking on top of the reference line, it can be dragged together with the text boxes indicating the
VERTICAL LINE PLOTTING.
It was really difficult to use vertical lines in symbolic plot therefore I created a function to plot it. In my code a person can determine the x-point ,starting point and end point of the line.

The Brick Toolbox is a set of utility functions for Matlab.

Detection of circular objects in a given image using Fisher criterion


Plot horizontal / vertical grid reference lines
GRIDXY(X) plots vertical grid lines at the positions specified by X. GRIDXY(X,Y) also plots horizontal grid lines at the positions specified by Y. GRIDXY(..., 'Prop1','Val1','Prop2','Val2', ...)

Plot horizontal and vertical lines
Plot horizontal and vertical lines by specifying vectors of their vertical or horizontal positions, respectively. Other options can be passed to the built-in line function.

Draws 'low-impact' horizontal or vertical lines on the current axes
' object.Further arguments allow the user to set the linetype and color of the line (default is 'r:'), and to add labels. For example:h = vline(42,'g','The Answer')will return a handle to a vertical line at x=42 on
Draws a horizontal or vertical line that persists through pans and zooms
VHLINE Draws a horizontal or vertical line that persists through pans and zooms. VHLINE('x',val) draws a vertical line on the current axes that intersect the x axis at the location specified by
Accurate Curvature and Normals of a line/contour consisting of 2D points
LineCurvature2D, This function calculates the curvature of a 2D line. It first fits polygons to the points. Then calculates the analytical curvature from the polygons. K =

Estimates the corner points of a pixelated convex polygon having a known number of vertices.
calculate the distance between a 2D or 3D line and one or more points
You can input either a 2D or a 3D line and 2D or 3D points. This function is an extended version of the line below, with some input checking:distance=norm(cross(v1-v2,pt-v2))/norm(v1-v2)Licence: CC

2-D Propagation Code for propagation in refractive media over irregular surface.
Get a table of contour line coordinates from a contour object.
getContourLineCoordinates(cm);--or-- contourTable = getContourLineCoordinates(h);contourTable = Level.........Group..........X............Y ____________________________________

Computes intersection points of two curves.
This function computes the (x,y) locations where two curves intersect. The curves can be broken with NaNs or have vertical segments. It is also very fast (at least on data that represents what I
Are 3D-testpoints located inside or outside an arbitrary watertight mesh with vertices and faces?
Computes/applies rotation about arbitrary 3D line.
Generates the roto-translation matrix for the rotation around an arbitrary line in 3D. The line need not pass through the origin. Optionally, also, applies this transformation to a list of 3D
plane_line_intersect computes the intersection of a plane and a segment(or
%plane_line_intersect computes the intersection of a plane and a segment (or a straight line)% Inputs: % n: normal vector of the Plane % V0: any point that belongs to the Plane % P0: end point 1

Finds the pairwise intersection points between line segments in 2D Cartesian space.
OUT = LINESEGMENTINTERSECT(XY1,XY2) generates intersection analysis between the line segment sets given in XY1 and XY2. Code can handle coincident and parallel lines.The main emphasis is on speed
Generic functions for matrix manipulation, image processing, etc.

Draws horizontal/vertical lines in graphs. Accept axes handle and allows user to specify label posit
I needed to draw some vertical markers to my plots in GUI, so I checked out Brandon Kuczenski's hline/vline submission. However it doesn't accept axes handle as an input argument. Getting around by
Draws a rubber band line and returns the x y coordinates of the end points.
[p1,p2]=rbline(varargin)Function to draw a rubberband line and return the start and end points. Usage: [p1,p2]=rbline; or [p1,p2]=rbline(h); where h is an axis handle. Click the mouse in the plot

The function implements LLBP (Line Local Binary Pattern)
and vertical shaped filter, resulting in "line" shape, for which the name is given.An illustration of Line LBP can be seen here

Simulation of the vertical behavior of vehicles. 3 models are presented, with two, four and seven degrees of freedom respectively.
freedom, relative to the vertical displacement $[Z_s]$ of the suspended mass $[m_s]$, as well as the vertical displacement $[Z_u]$ of the unsprung mass $[m_u]$.The stiffness of the suspension is represented
Exports 3d line elements into a DXF file for further use with CAD software.
Given a filename and a 3d line where each line element is specified by X,Y, and Z coordinates it writes a DXF file with the a connected line and N vertices.
Calculates the parameters (and their uncertainties) to data with uncertainties in both coordinates
slope/y-axis intersection pair to slope angle and distance to the origin. The advantages of this are that a) global convergence is assured b) a solution is found even for a vertical line. The complete
Plot lines with CData, (actually surface)
plots a 2-D "line" with c-data as colorMakes a surface object and the colouring is controlled by the colormap.Examples: x = 0:0.1:2*pi;color_line(x,sin(x),sin(x))color_line(x,cos(x),cos(x),'*')

Improves the style of lines in MATLAB generated eps files

gcbl returns the handle/handles of the current line in the current system.
.% Date : 20-January-2019 07:41:00% Updates : 1. Gives Line handles for the selected line.% 2. If multiple lines are tapped to the single line the

Smooths contour lines by fitting them with a 2-D spline.
V.CONTOURSPLINE(X,Y,Z,[v v]) draws a single contour line at level v.Beware: CONTOURSPLINE smooths contours, but does not magically change terrible data into pleasing data. For terrible data, smoothed contour lines may cross!

Use your custom line style
Use your custom line style with function named plot_dashYou can design your line pattern and its length by the parameter spec_ and num_For instance, Matlab default dashed line ∽ spec_ = [1, 0.5], n
An updated GUI to simulate billiard systems on Matlab.

Finds the intersection of two lines.
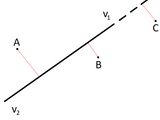
line_intersection Finds the intersection of two lines.Syntax[x_int,y_int] = line_intersection(l1,l2)Inputsl1 (1×1, 1×2, 1×3, or 1×4 double) vector defining line 1:[x1]: vertical line form, [m1,b1
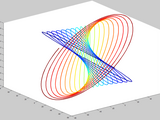
Plot a 2D or 3D line using a specified colormap.
% H = colormapline(X,Y,Z,C) Plot a line using a specified colormap% If Z is given, a 3D plot with coordinates X, Y, Z is created.% If Z is not given, a 2D plot of Y over X if created.% If Y and
Like plot3, but will plot a real (round, flat, triangle, squared) thick shaded 3D line
This function works like plot3, but will display a real 3D round (vessel like), flat, triangle or squared line. Which can be shaded, because the surface is a triangulated patch.
Draw nan-separated lines (or a single line) onto Google Earth.
airplane track). Syntax: KML_LINE(LON, LAT) writes nan-separated lines specified in LON and LAT to an output file, doc.kml KML_LINE(LON, LAT, NAME) writes nan-separated lines specified in LON

MATLAB Custom AppDesigner's Components
Draw a line with an arrowhead.
ARROW (5/02/2023) Draw a line with an arrowhead.ARROW(Start,Stop) draws a line with an arrow from Start to Stop (points should be vectors of length 2 or 3, or matrices with 2 or 3 columns), and

Combines line plotting with annotation arrows.
### line2arrow.m Documentation[
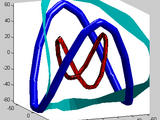
Plots a 3D line with color encoding along the length using the patch function.
This function plots a 3D line (x,y,z) encoded with scalar color data (c). This function is an improvement over the CLINE function previously made available on TMW File Exchange. Rather than using

Generate vertices, faces and color for u3d format and display it in pdf or doc, xls and ppt
Generate a line profile of a 2d image
Generate a line profile of a 2d image using Bresenham's algorithm.For a demo purpose, trybresenham();

A GUI to simulate billiard systems on Matlab.
An alias of the LINE command, with additional control for markers, in number and location.
Allows control of nr of markers, and positioning uniformly along x or along the curve, and with the option to lock on a local max. Accept same inputs as the LINE command, with the additional

Plot 3D lines with CData, (actually surface)
plots a 3-D "line" with c-data as color Makes a surface object and the colouring is controlled by the colormap.Example:v_start = [2 1 8]; % m/sg = 9.81; % m/(s^2)t_impact = 2*v_start(3)/g; % st =
You can also select a web site from the following list
Americas
- América Latina (Español)
- Canada (English)
- United States (English)
Europe
- Belgium (English)
- Denmark (English)
- Deutschland (Deutsch)
- España (Español)
- Finland (English)
- France (Français)
- Ireland (English)
- Italia (Italiano)
- Luxembourg (English)
- Netherlands (English)
- Norway (English)
- Österreich (Deutsch)
- Portugal (English)
- Sweden (English)
- Switzerland
- United Kingdom (English)
Asia Pacific
- Australia (English)
- India (English)
- New Zealand (English)
- 中国
- 日本Japanese (日本語)
- 한국Korean (한국어)