2,175 results

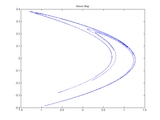
These codes generate Rossler attractor, bifurcation diagram and poincare map.
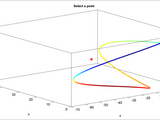
Given a multi-dimensional time series, find the points where the trajectory crosses a given plane. This is useful for finding periodicity.
Useful if you record multi-dimensional time-series data and want to look for periodicity. This function finds the points where the trajectory crosses a given plane. % P = poincare_map( X [, plane
Companion Software.
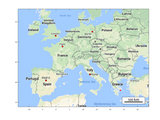
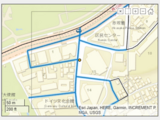
Plot a google map on the background of the current figure using the Static Google Maps API.
plot_google_map.m uses the Google Maps API to plot a map in the background of the current figure. It assumes the coordinates of the current figure are in the WGS84 datum, and uses a conversion code

Lynch files to accompany the book.

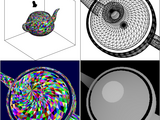
This routine plots the Stokes vectors on a 3-D Poincare sphere using a graphical user interface.
This script plots the polarization Stokes vectors (S1, S2, S3) on a Poincare sphere. See "Polarized Light" by Collett (publ. Dekker) for a background on the optics.Type "poincare" at the Matlab

Computation of Friedrichs and Poincare constants in 2D/3D from generalized eigenvalue problems.
Poincare are approximated from a generalized eigenvalue problems. Approximated values are compared with exact values if these are known (eg. for the rectangular domain in 2D and the cuboid domain in 3D) and
Highly comparative time-series analysis
Visualization of 4D dynamical system.

Retrieve a google map from the command line using the Static Google Maps API.
The function get_google_map.m uses the Google Maps API (https://developers.google.com/maps/documentation/static-maps/) to retrieve a google map image from Google given coordinates of the center of
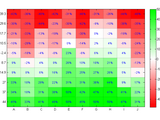
Visualize data as a heatmap with many customizable options.
labels. The labels update automatically with zooming, panning or resizing the figure.* Custom color maps: Use MATLAB's default color maps or specify your own. The function provides two additional color
Transforms map data into lat/lon coordinates for a polar stereographic map projection. NSIDC/SCAR
transformations to geographic coordinates from map coordinates to facilitate comparisons with other datasets.POLARSTEREO_INV transforms map coordinates to lat/lon data for a polar stereographic system

Create color maps from actual names that people use for colors.
, the way they are perceived on computer monitors. The rgbmap function presented here creates color maps using any number of these strings as inputs.SYNTAXcmap = rgbmap('first color name','second color
Transforms lat/lon data into map coordinates for a polar stereographic map projection. NSIDC/SCAR
POLARSTEREO_FWD transforms lat/lon data to map coordinates for a polar stereographic system [X,Y]=POLARSTEREO_FWD(LAT,LONG,EARTHRADIUS,ECCENTRICITY,LAT_TRUE,LON_POSY) X and Y are the map

Draw circles on maps
Drawing a circle of a given radius on a map using Matlab's built-in functions is surprisingly unintuitive. So when there's some sort of outbreak or nuclear threat emanating from a city and you need
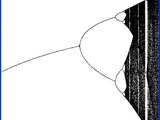
The logistics map (bifurcation diagram of the logistics equation).
The logistics map is a classic example of transition from stable to chaotic behavior as a single parameter changes value. This script plots the semi-stable values of x(n+1) = r*x(n)*(1-x(n)) as r is

This GUI programe presents an efficient method for finding topological horseshoes in chaotic systems
graphical user interface. Readers only need to write an m-function for their chaotic maps (or Poincar'e maps for time-continuous system). Beside this, almost all operations for finding a horseshoe are mouse
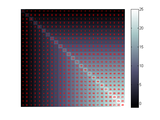
Heat maps with numeric values overlayed

Seamlessly merge a bar chart with a map to display geographically-coded categorical variables
described:Idx: Index of data. This could be countries, provinces, etc.BoundingBox: Maximum and minimum latitude and longitude values.Lon and Lat: Vertices defining the boundaries of the map object. These can be
Simulation of Chua's Oscillator in MATLAB with Poincare Section analysis.
nonlinearity and a cubic nonlinearity.A Poincare Section analysis tool is also included which works on the piecewise linear nonlinearity version. It calculates the 2-D map and the approximate 1-D map which may

Implementation of MAP Algorithm.
This program includes:[5 7] convolutional code (encoder) + BPSK + AWGN + MAP (decoder). It evaluates Bit Error Rate and plots it versus SNR(signal to Noise Ratio).
Log-MAP is denoted as "Simplified MAP." Max-Log MAP is denoted as "MAX MAP."
This contains BER simulation both Log-MAP and Max-Log MAP for a range of Eb/No with graphical representation of BER Vs Eb/No.For any clarifications on this code, Reach me through comment box.
Automated Driving Toolbox Importer for Zenrin Japan Map API 3.0 (Itsumo NAVI API 3.0) Service
MathWorks Automated Driving Toolbox TeamCreate driving scenarios using imported road data from Zenrin Japan Map API 3.0 (Itsumo NAVI API 3.0).
Zenrin Japan Map API 3.0 (Itsumo NAVI API 3.0) is a map service which provides high-quality road and lane data in Japan. This data can be used to develop automotive applications.This support package
MapN provides a map class similar to containers.Map, but with multidimensional keys.
MapN provides a multidimensional map container. A MapN object contains key lists and values. A value is some unit of data that you want stored in the MapN object, and a key list is a unique reference
The Henon map discrete time dynamical system.
This is a simple implementation of the Henon system. It is a discrete time system that maps a point $(x_n,y_n)$ in the following fashion: $x_{n+1}=1-a x_n^2 + y_n$ $y_{n+1}=b x_n$Where a and b are
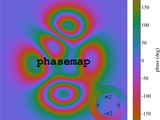
A constant-lightness cyclic colormap for phase.
lightness is good for displaying phase because it does not put strong emphasis on any part of the color map. A well-written and aesthetically-pleasing overview of Kristen's cmocean colormaps can be found

Graphical User Interface (GUI) for generating maps using the mapping package M_Map.
MAP-LAB is a MATLAB-based Graphical User Interface (GUI), created for producing maps and visualizing data sets related to geodetic and oceanographic applications. The main idea behind the design of

MATLAB interface to aid in plotting of VMEC output.
Please click the thumbnail to watch the GIF file. 概要はサムネイルをクリックして下さい.This demo shows how to continuously create a class activation mapping.
Saves a figure out as a PNG-file and creates a corresponding HTML-file with an image map.
to "map".Empty text objects mark the hotspots on the imagemap. Set their 'tag' to be 'click' and their UserData to a structure with two fields, "url" and "description". These fields specify the target

pentagonal tiling of the Poincare Disc hyperbolic geometry

A MATLAB toolbox for exporting publication quality figures
A notable use case is to simulate RGB or Kinect (depth) camera images for computer vision applications.
3D Rendering Toolbox: Color images and depth maps from 3D meshesImplementation of the computer graphics pipeline for triangulated meshes, in addition to a number of camera plotting functions. Handles
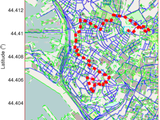
Load map, extract connectivity, plot road network & find shortest paths from OpenStreetMap XML file.
This software package includes functions for working with OpenStreetMap XML Data files (extension `.osm`), as downloaded from http://www.openstreetmap.org, to:1) Import and parse the XML data file
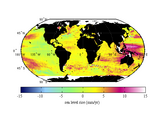
A simple example of how to create a map of sea level rise using publicly-available data.
This is a simple example of how to turn text data into mapped data.
A toolbox for analysis and display of Antarctica-related data
Or: Antarctic Mapping Tools for Matlab, Greenland Edition

Conformally map a simply-connected open triangle mesh to a rectangle

Converting an input map (image) into a Graph
%%------------------------------------------------------------------------------------%% PARAMETERS:%% INPUTS:---------------------------------------% ** INPUT IMAGE: i.e. InputImage='Map8_2.jpg';% THE INPUT IMAGE CAN BE .JPG OR .PNG OR .BMP ETC%% ** RADIUS: IT IS RADIUS OF THE ROBOT, THIS

Generates one of four colormaps using schemes proposed in technical literature
This submission was inspired by comments from Ned Gulley in a recent Blog by Doug Hull. Ned cited an EOS article by A. Light and P.J. Bartlein who proposed some color maps designed for colorblind
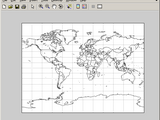
Draws a flat world map with coastal and political boundaries for use with Mapping Toolbox 2.x
Mapping Toolbox versions 2 (and later) have not supplied political boundary information as former versions did. This function easily creates a simple flat world map in the Miller projection with

Computes estimated values of Lyapunov exponent of logistic map for r within the interval (3.5,4)
function LE = LEofLogisticMap( rStart, rEnd, rStep )calculates Lyapunov exponent of logistic map x(t+1) = r*x(t)*(1-x(t)) for r within the interval (3.5,4) using derivative for values of control

Map a surface mesh onto a planar unit circle, using Tutte's algorithm
Usage: [mfTutteMap] = TutteMap(mnTriangulation) Maintaining the existing triangulation, this function maps a surface mesh onto a planar unit circle. Tutte's algorithm [1] is used. The simple

computes residue curve map
The program computes the residue curve map for the ternary mixture benzene-toluene-p-xylene. When you change the mouse's position, a new residue curve is computed and displayed. Residue curve maps
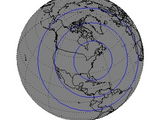
Two quick and easy functions to create simple map figures.
issues:(1) how to get a simple map of the world into a figure quickly, and(2) how to get a quick rotatable globe into a figure quickly.The functions I've uploaded, DRAWMILLER and DRAWGLOBE take care of these

Region-based depth-map inpainting
Region-based depth recovery. Takes as input a sparse depth map (with NaN's at the location of missing values) and a guidance segmentation label matrix, and returns the recovered depth map. This is
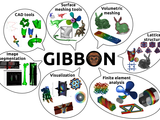
GIBBON: The Geometry and Image-Based Bioengineering add-ON for MATLAB

Multi-Dimensional Data Visualization
dimensions for the analysis,- display the data in images or maps dynamically linked to graphs, so as to identify trends.
Functions for computing and visualizing upslope area, influence map, dependence map
processing blog, March-August 2007, http://blogs.mathworks.com/steve.Requires Image Processing Toolbox.Functions include dem_flow, dependence_map, facet_flow, fill_sinks, flow_matrix, influence_map, pixel_flow

Extensive numerical simulation of the double pendulum
, Newmark+Newton-Raphson)- Animation: 2 non-linear pendulum released with 0.1° difference of inital angle- Graph: Phase portait and Poincaré map- Graph: Energy of the system vs. time- Graph: Bifurcation diagram- Animation

Uses .xyz data to create a non-linear colour map for an elevation map.
This script is takes .xyz fdata and plots it using a non-linear colour map. A full explanation of the of the code is available at http://topographycolourmap.wordpress.com/
GISMO - a framework for scientific research in seismology/infrasound

Matlab interface to the siibra toolsuite
Exchange](https://www.mathworks.com/matlabcentral/images/matlab-file-exchange.svg)](https://de.mathworks.com/matlabcentral/fileexchange/121148-siibralab)``siibra`` is a toolsuite which connects neuroscience data from different modalities and resources to anatomical structures defined in brain parcellation maps, and links reference coordinates spaces at

Region-of-interest selection for saliency maps
A detailed discussion of the ROI detection algorithm can be found here, with examples:http://imageprocessingblog.com/region-of-interest-selection-for-saliency-maps/This is an implementation of the

Quiver (vector) with a reference vector or color code on a map or Cartesian axes.
of the plot axes. The function works for both map and Cartesian axes and allows the color of vectors to be changed.If a reference value is not provided, the reference value is calculated by rounding

Increases resolution of time-frequency maps by combining CWT maps for different Q-factors and rotations (chirplets) of the mother wavelet
Computes the combinations of multiple sets of continuous wavelet transforms (time-frequency maps) obtained for different quality factors Qf of the Gabor mother wavelet as well as for different

Reads Analyze 6.0 ROI Object Map format (*.OBJ)
decodeOBJ reads Mayo Clinic Analyze 6.0 ROI Object Map format (*.OBJ) files.http://www.mayo.edu/bir/Software/Analyze/AnalyzeTechInfo.htmlI spent about an hour examining Object Maps in a hex editor

A function to explain a stereo-like taxonomy to be used in light field depth estimation
This file is provided in conjunction to the submission to STSIVA 2014, please read the paper when available to understand the content: Title ---Depth Map Estimation In Light Fields Using An

Conformally map a genus-0 closed triangle mesh to the unit sphere

The complete palette of ColorBrewer 2.0 colormaps. Simple selection by scheme name and map length.
You can also select a web site from the following list
Americas
- América Latina (Español)
- Canada (English)
- United States (English)
Europe
- Belgium (English)
- Denmark (English)
- Deutschland (Deutsch)
- España (Español)
- Finland (English)
- France (Français)
- Ireland (English)
- Italia (Italiano)
- Luxembourg (English)
- Netherlands (English)
- Norway (English)
- Österreich (Deutsch)
- Portugal (English)
- Sweden (English)
- Switzerland
- United Kingdom(English)
Asia Pacific
- Australia (English)
- India (English)
- New Zealand (English)
- 中国
- 日本Japanese (日本語)
- 한국Korean (한국어)