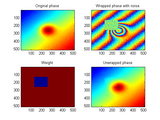
Robust and fast 2D weighted phase unwrapping based on Ghiglia and Romero (1994)
unwrap the phase. This scripts implements the algorithm from Ghiglia and Romero (1994) that uses least-square methods to solve the problem. The algorithm runs relatively quickly and the algorithm is also
- 2.8K (All time)
- 11 (Last 30 days)
- 4.6 / 5
- Community
-
22 Nov 2016

Function to unwrap phase having 2*pi jumps just after phase extraction from interferogram
Phase unwrapping with implementing TV (Total Variation) minimization algorithm.
This is the function to unwrap 2*pi jumps on extracted phase from interferogram. This function implemented TV (Total Variation) minimization algorithm (ANTONIN CHAMBOLLE, “An Algorithm for Total
- 1.4K (All time)
- 2 (Last 30 days)
- 4.5 / 5
- Community
-
24 Feb 2016

Magnitude-Sorted List, Multi-Clustering Phase Unwrapping Algorithm
Robust Phase Unwrapping for MR Temperature Imaging
The 'example.m' script shows how to use the algorithm. The file 'sunwrap.m' contains the actual algorithm.The code is available here:GitHub: https://github.com/fmaier/MRM-2014-Phase
- 6.8K (All time)
- 6 (Last 30 days)
- 4.8 / 5
- Community
-
31 Mar 2015
Calibrated 2D phase unwrapping algorithm based on least-squares and iteration
an approach to deal with high noise and to unwrap successfully phase data
Taking into account influence of noise in wrapped data, a calibration method of the 1st order spatial phase derivative is proposed and an iterative approach is presented.
- 727 (All time)
- 2 (Last 30 days)
- 5.0 / 5
- Community
-
8 Dec 2016
Robust 2D phase unwrapping algorithm
2D phase unwrapping algorithm based on the Transport of Intensity Equation(TIE) and unwrapped phase correction.
we develop a simple and robust phase-unwrapping algorithm based on the transport of intensity equation (TIE). In our method, the TIE was solved using the fast cosine transform, and a phase correction
- 2.6K (All time)
- 9 (Last 30 days)
- 5.0 / 5
- Community
-
15 Aug 2018
Phase unwrapping algorithms by solving the Poisson equation
Several direct and iterative phase unwrapping algorithms based on solving the Poisson equation are presented.
Several direct and iterative phase unwrapping algorithms based on solving the Poisson equation are presented. The differences between them are the way to calculate the input and output of the
- 647 (All time)
- 3 (Last 30 days)
- 5.0 / 5
- Community
-
10 Jun 2019

Implementation of Costantini's 2D unwrapping method based on network programming
- 5.6K (All time)
- 2 (Last 30 days)
- 4.8 / 5
- Community
-
29 Aug 2009
2D and 3D Phase Unwrapping using SRNCP
2D & 3D phase unwrapping plugins for Matlab
compile:mex phaseUnwrap.cppInput must be a real, double matrix from Matlab.
- 1.8K (All time)
- 5 (Last 30 days)
- 5.0 / 5
- Community
-
3 Jun 2020

Fast 2D phase unwrapping implementation in MATLAB
. Kasim, "Fast 2D phase unwrapping implementation in MATLAB", https://github.com/mfkasim91/unwrap_phase/ (2017).This algorithm is also available from GitHub (https://github.com/mfkasim91/unwrap_phase/)
- 4.8K (All time)
- 22 (Last 30 days)
- 4.0 / 5
- Community
-
26 Aug 2021

Quantitative Magnetic Resonance Imaging Made Easy with qMRLab: Use GUI or CLI to fit and simulate a myriad of qMRI models.
- 923 (All time)
- 4 (Last 30 days)
- 5.0 / 5
- Community
-
7 Dec 2023

- 11.4K (All time)
- 20 (Last 30 days)
- 4.9 / 5
- Community
-
1 Aug 2024

Release 10.0301 of a collection of functions for analysis/display of seismic and well-log data.
- 23.6K (All time)
- 6 (Last 30 days)
- 4.4 / 5
- Community
-
1 Mar 2010
2D phase unwrapping algorithms
Implementations of the phase quality path following method and Goldstein's branch cut method.
Two 2D phase unwrapping approaches are included:1. Phase quality guided path following method.2. Goldstein's branch cut method.The algorithms are described in:D. C. Ghiglia and M. D. Pritt
- 17.2K (All time)
- 13 (Last 30 days)
- 4.1 / 5
- Community
-
23 Feb 2009

Phase unwrapping by accumulation of residual maps
Implements the paper "Phase unwrapping by accumulation of residual maps," OLEN, 2015.
Description: this code implements the paper:[1] Mariano Rivera, Francisco Hernandez-Lopez and Adonai Gonzalez, "Phase unwrapping by accumulation of residual maps," to appear in Optics and Lasers in
- 1.1K (All time)
- 1 (Last 30 days)
- 4.0 / 5
- Community
-
14 Oct 2014

Fast Checkerboard Demodulation for digital Schlieren imaging
Track optical distortions in a checkerboard pattern with high accuracy in real-time using the FCD method
track displacements as small as 0.01 pixels and up to about 4 pixels (For larger displacements phase unwrapping may be required. A basic implementation for this is included.)- Can resolve high virtual
- 385 (All time)
- 5 (Last 30 days)
- 5.0 / 5
- Community
-
9 Dec 2018
Updated Goldstein's branch cut method of 2D phase unwrapping
This is an update of Bruce Spottiswoode's 2D phase unwrapping algorithms. This version runs much faster. This was partly done by cleaning up the decision logic.Also, it matches +/- residues by having
- 20.3K (All time)
- 8 (Last 30 days)
- 4.7 / 5
- Community
-
23 Nov 2010

A simulator for evaluating Gaussian optics and simulate projection onto a photodiode.
A simulator for evaluating Gaussian optics and simulate projection onto a photodiode. Visual representation of intensity/phase fields as described by Gaussian optics.A simulator for evaluating
- 127 (All time)
- 1 (Last 30 days)
- -- / 5
- Community
-
19 Jan 2021
Phase Unwrapping using Recursive Orthogonal Referring (PUROR)
PUROR presents a fast phase unwrapping algorithm.
Liu J. and Drangova M., "Intervention-based multidimensional phase unwrapping using recursive orthogonal referring", Magnetic Resonance in Medicine, Volume 68(4):1303-1316, 2012
- 722 (All time)
- 1 (Last 30 days)
- -- / 5
- Community
-
4 Feb 2014

Phase Unwrapping MATLAB Code and Example Data (FAPUX method)
MATLAB Code and Example Data for Fast and Accurate Phase Unwrapping of Complex Phase Maps
This MATLAB package provides FAPUX implementation for fast, accurate, and robust phase unwrapping solution, designed to handle challenging phase maps with discontinuities, and intricate spatial
- 112 (All time)
- 10 (Last 30 days)
- -- / 5
- Community
-
21 Aug 2025

- 1.7K (All time)
- 5 (Last 30 days)
- 4.9 / 5
- Community
-
4 Nov 2020
Updates the phase quality-guided path following phase unwrapping method by Bruce Spottiswoode
logic more parallel to the updated GoldsteinUnwrap2D_r1 code. Corrected one line in PhaseDerivativeVariance_r1.m. the phase quality path following phase unwrapping method by Bruce Spottiswoode.
- 2.3K (All time)
- 5 (Last 30 days)
- 4.0 / 5
- Community
-
1 Dec 2010
PCG_unwrap_2D(ph_nii, ph_file, mask_nii, max_iter, epsi_con, N)
2D weighted Laplace unwrapping with preconditioned conjugate gradient algorithm
This phase unwrapping algorithm is based on the theory and c++ code from: "Two-Dimensional Phase Unwrapping, Theory, Algorithms, and Software" written by Dennis C. Ghiglia and Mark D. Pritt This
- 717 (All time)
- 1 (Last 30 days)
- 5.0 / 5
- Community
-
14 Jun 2016

Reconstruction of off-axis hologram
Reconstruction of off-axis hologram
This MATLAB code reconstructs an off-axis hologram with phase unwrapping of the reconstructed phase distribution. For details see: T. Latychevskaia, P. Formanek, C.T. Koch, A. Lubk, "Off-axis and
- 913 (All time)
- 3 (Last 30 days)
- -- / 5
- Community
-
7 Jan 2022

Improved Bandpass Phase Unwrapping.
Unwrapping the phase of bandpass filter measurements produces unreliable results. This submission addresses the problem.
The stock MATLAB unwrap.m function works great for data that has a lowpass frequency response. Bandpass data is a different story. The stopbands of the bandpass data is at each extreme of the
- 59 (All time)
- 1 (Last 30 days)
- -- / 5
- Community
-
12 Jan 2022

Methods for B0 Mapping with Multi-Channel RF Coils in MRI (Robinson and Jovicich, MRM, 2011)
The main features of this B0 field mapping (FM) toolbox are describedin Robinson and Jovicich (MRM, 2011). In brief, they arei) combination of phase information from multi-channel coils using
- 4.1K (All time)
- 1 (Last 30 days)
- 4.3 / 5
- Community
-
8 Jul 2011
Fast 2D phase unwrapping compiled from skimage
Compiled from https://github.com/scikit-image/scikit-image/blob/main/src/skimage/restoration/unwrap_2d_ljmu.c
Fast 2D phase unwrapping compiled from skimage https://github.com/scikit-image/scikit-image/blob/main/src/skimage/restoration/unwrap_2d_ljmu.c by David Gouyoumdjian at DigitalHolography Fundation
- 5 (All time)
- 1 (Last 30 days)
- -- / 5
- Community
-
6 Nov 2025
IEV represents an algorithm for local frequency mapping from multi-ch and multi-echo data
- 244 (All time)
- 1 (Last 30 days)
- -- / 5
- Community
-
21 Apr 2014

Plot the phase portrait for the entered system of differential equations
: https://drive.google.com/drive/folders/1152DOOwuD15LD_EzwgH3XpRv08BDNzFc?usp=sharingChapter 2 provides a quick overview of the theoretical background. Chapter 3 contains the user guide and description of features.Chapter 4 provides some real life examples and phase portraits generated
- 8.7K (All time)
- 59 (Last 30 days)
- 5.0 / 5
- Community
-
28 Mar 2021
Performs 2D phase unwrapping, even if image is not squared. The angles should be in radians
Performs 2D phase unwrapping, even if image is not squared. The angles should be in radians between -pi and pi rangehttp://www.ncbi.nlm.nih.gov/pmc/articles/PMC2575666/
- 191 (All time)
- 1 (Last 30 days)
- 5.0 / 5
- Community
-
4 Dec 2015

Phase Plane and Slope Field apps
You can use the Phase Plane and Slope Field apps to qualitatively analyze ordinary differential equations (ODEs).
Slope Field and Phase Plane apps have been written entirely from scratch in MATLAB App Designer using modern MATLAB coding practices. This makes the new apps easier to maintain, edit, and use.Getting
- 10.9K (All time)
- 169 (Last 30 days)
- 4.8 / 5
- Community
-
18 Nov 2023

MATLAB for Digital Communication
The MATLAB programs in "MATLAB/Simulink for Digital Communication" authored by Won Y. Yang et. al
Sideband)-AM(Amplitude Modulation)3.2 ANGLE MODULATION - FREQUENCY/PHASE MODULATIONSCHAPTER 4: ANALOG-TO-DIGITAL CONVERSION4.1 QUANTIZATION 4.1.1 Uniform Quantization 4.1.2 Non-uniform Quantization
- 65.9K (All time)
- 14 (Last 30 days)
- 4.6 / 5
- Community
-
11 Sep 2009

Unwraps angles so that continuity is restored.
inputs change continuously, the angle will exhibit 2*pi jumps across the limits, which is sometimes undesirable (e.g. when the angle drives a control system).This block unwraps an input angle to the whole
- 2.9K (All time)
- 2 (Last 30 days)
- -- / 5
- Community
-
20 May 2023
- 1.1K (All time)
- 7 (Last 30 days)
- 4.5 / 5
- Community
-
14 Aug 2023

MP3 a medical imaging toolbox (MRI, CT, PET...)
Medical software for Processing multi-Parametric images Pipelines
- 1.3K (All time)
- 21 (Last 30 days)
- 5.0 / 5
- Community
-
18 Aug 2023

Quantitative Susceptibility Mapping for MRI part 1
Superfast Quantitative Susceptibility Mapping from MRI phase data.
- 1.4K (All time)
- 2 (Last 30 days)
- 5.0 / 5
- Community
-
28 Apr 2016

- 1.5K (All time)
- 5 (Last 30 days)
- 4.7 / 5
- Community
-
11 Apr 2023

Phase Spectrum Compensation (PSC) framework for speech enhancement.
Basic implementation of the Phase Spectrum Compensation (PSC) [1] method for single channel speech enhancement is included, along with a demo that illustrates its usage. References:[1] A.P. Stark
- 2.9K (All time)
- 2 (Last 30 days)
- 5.0 / 5
- Community
-
21 Mar 2011

Starting Six Phase Asymmetrical Induction Motor with Malfunction in Phase A
Six phase induction motor starts without one phase
This simulation simulates transient and steady state period in case of starting a six phase asymmetrical induction motor with malfunction in phase A (Phase A current is zero). The interesting thing
- 549 (All time)
- 8 (Last 30 days)
- 5.0 / 5
- Community
-
15 Feb 2018
Windowed Fourier transform for fringe pattern analysis
To process fringe patterns obtained from optical interferometry, fringe projection, SAR, MRI etc.
wft2f.m is for windowed Fourier transform. Please use "help wft2f" for details.unwrapping_qg_trim.m is for quality guided phase unwrapping. Please use "help unwrapping_qg_trim" for details.
- 4.4K (All time)
- 2 (Last 30 days)
- 5.0 / 5
- Community
-
24 Jul 2009

This MATLAB exercise implements a phase vocoder.
This MATLAB exercise implements a phase vocoder with the capability of speed-up or slow-down of a speech or audio signal by a factor, r, which varies from r = 0:25 (slow-down by factor of 4) to r =
- 2.3K (All time)
- 1 (Last 30 days)
- 5.0 / 5
- Community
-
23 Jun 2015

phase plane plotting for a second order nonlinear system
Phase plane portrait is a very important tool to study the behavior and stability of a non-linear system.PhasePlane(sys,tspan,icond) plots the the phase plane portrait for a general second order
- 4.8K (All time)
- 19 (Last 30 days)
- 5.0 / 5
- Community
-
5 Feb 2018
Phase Portrait Plotter on 2D phase plane
This function could plot the phase portrait of the 2-dimentional autonomous system, and is configurable for arrows, vector fileds, etc.
, we only need one single command to get the phase portrait.plotpp(@(t,x)[x(2);-x(1)-1*x(2)])In the second example, we plot the phase portrait of the van der Pol equation:We set the time span to 20
- 5.5K (All time)
- 67 (Last 30 days)
- 5.0 / 5
- Community
-
15 May 2022

MATLAB phasors
Useful for electric phasors. Functions:Descripe phasors in polar as: R = [Length Angle]a = [30 40]b = [10 30]c = [40 -59]Pkon: Complex conjugatepkon(c) == [40 59]Pmult: Polar
- 1.4K (All time)
- 2 (Last 30 days)
- 5.0 / 5
- Community
-
21 Feb 2019

Plots the phase portrait of the Lorenz system.
Plots the phase portrait of the Lorenz system. Results are shown at each time interval, thus creating an animation. Solution can be viewed at several angles (az and el need to be changed). Feel free
- 751 (All time)
- 2 (Last 30 days)
- 5.0 / 5
- Community
-
21 Apr 2014

Phase Difference Measurement with Matlab
Phase difference measurement between two signals via DFT or cross-correlation.
The present code is a Matlab function that provides a measurement of the phase difference (as an angle) or time difference (as time duration) between two signals. In the first case, the measurement
- 8.6K (All time)
- 8 (Last 30 days)
- 4.7 / 5
- Community
-
31 Oct 2023

Visualizing Phasors, an Animated GUI
A tool for visualizing phasor (voltage, current, impedance), along with animation.
This program is a GUI that let's you specify two of three phasors (voltage, current, impedance). The other phasor is calculated. The phasors are displayed, inluding and animation of the voltage and
- 10K (All time)
- 5 (Last 30 days)
- 4.5 / 5
- Community
-
20 May 2003
- 674 (All time)
- 2 (Last 30 days)
- 5.0 / 5
- Community
-
5 Nov 2017
Three-Phase Modular Multi-Level Converter (3-Phase MMC)
This example implements a Three-Phase Modular Multi-Level Converter (MMC).
This example shows the operation of a Three-Phase Modular Multi-Level Converter (MMC) using only Simscape™ Electrical™ Specialized Power Systems (SPS) components.It shows how to control in open-loop
- 1.7K (All time)
- 23 (Last 30 days)
- 5.0 / 5
- Community
-
3 Jun 2021

High Performance Single-Phase PLL with SFT phase detector
The Simulink model of A high-performance single-phase SFT-based PLL that gives outstanding performance is given
A high performance single-phase phase-locked loop using a sliding Fourier transform is proposed in this paper. The new PLL is using the sliding Fourier transform as a phase detector. The orthogonal
- 988 (All time)
- 7 (Last 30 days)
- 5.0 / 5
- Community
-
21 Nov 2019

Stator Voltage Control of Three Phase Induction Motor fed by Three Phase AC Voltage Controller
Stator Voltage Control of 3-phase IM is implemented by use of 3-Phase Ac voltage controller
The Circuit simulated above is one of the topologies of 3-Phase AC Voltage Controllers whose output is fed to IM for drive applications* A Pdf file is attached to best explain the operation of the
- 4.8K (All time)
- 3 (Last 30 days)
- 5.0 / 5
- Community
-
15 Feb 2013
Jitter from phase noise vs. frequency data Calculates RMS jitter from phase noise power.
Usage:Jitter = Pn2Jitter(f, Lf, fc)Inputs:f: Frequency vector (phase noise break points), in Hz, row or column.Lf: Phase noise vector, in dBc/Hz, same dimensions, size(), as f.fc: Carrier frequency
- 5.2K (All time)
- 2 (Last 30 days)
- 5.0 / 5
- Community
-
9 Nov 2008


Binary Phase Shift Keying Simulation.
This script simulates the Binary Phase Shift keying. Since BPSK is a digital modulation scheme, you can modulate as many bits as you want. however, I have only simulated it for few bits, so that the
- 3.4K (All time)
- 3 (Last 30 days)
- 5.0 / 5
- Community
-
1 Mar 2011

Near-Field to Far-Field Transformation for Antenna Measurements
. Werner, "Satellite Radar Interferometry: Two-Dimensional Phase Unwrapping", Radio Sci., Vol. 23, No. 4, pp. 713-720, 1988.9. D. C. Ghiglia and M. D. Pritt, "Two-Dimensional Phase Unwrapping: Theory
- 9.4K (All time)
- 11 (Last 30 days)
- 4.9 / 5
- Community
-
26 May 2024

Phase Plots of Complex Functions
Routines for creating color representations of complex functions (phase plots)
The ZIP-file provides several routines for creating color representations of complex (in particular analytic and meromorphic) functions. Basically the argument (phase) of the function is encoded by a
- 1.9K (All time)
- 3 (Last 30 days)
- 5.0 / 5
- Community
-
16 Jan 2014
Simultaneous phase randomization of a set of time series
It creates blocks of surrogate data with the same second order properties as the original time series dataset by transforming the original data into the frequency domain, randomizing the phases
- 1.1K (All time)
- 3 (Last 30 days)
- 5.0 / 5
- Community
-
21 Aug 2011

Quadrature Phase Shift Keying Signal generator
Quadrature Phase Shift Keying signal generator for analysing how two Binary Phase Shift Keying signals can be combined together to generate a Quadrature Phase Shift Keying signal. The program
- 268 (All time)
- 2 (Last 30 days)
- 5.0 / 5
- Community
-
26 Jul 2016

Six Phase Induction Motor Fully Modeled
Six phase induction motor is modeled in stacionary reference frame. Unlike three phase machine, six phase machine model contains two stacionary ortogonal coordinate frames: alpha-beta and x-y frame
- 2.3K (All time)
- 20 (Last 30 days)
- 5.0 / 5
- Community
-
15 Feb 2018

Computes the Phase Locking Value (PLV) for neuroelectric signals.
Phase Locking Value (PLV) is a statistic that can be used to investigate task-induced changes in long range synchronization of neural activity. This method is introduced in Lachaux et al., (1999
- 6.1K (All time)
- 5 (Last 30 days)
- 5.0 / 5
- Community
-
16 Aug 2011

- 1K (All time)
- 9 (Last 30 days)
- 5.0 / 5
- Community
-
18 Jan 2021