ashape: a pedestrian alpha shape extractor
extracts 2d alpha shapes from a set of x/y data points
ASHAPE is a simple wrapper for ASLIB, which implements several (optimized) subroutines to extract and display 2d alpha shapes and alpha patches from a set of x/y data pointsASLIB returns a structure
- 21.5K (All time)
- 2 (Last 30 days)
- 5.0 / 5
- Community
-
13 Apr 2010

Convert alphaShape object to binary image
im_out = alphaShape2im(shp,center_coord,im_size,scaling) creates a binary image with size im_size that represents a given alphaShape "shp". "alphaShape2im" maps the center voxel(s) to the reference
- 346 (All time)
- 2 (Last 30 days)
- 5.0 / 5
- Community
-
1 Sep 2016

- 2.8K (All time)
- 2 (Last 30 days)
- 5.0 / 5
- Community
-
1 Dec 2023
Functions to compute many proximity graphs and their relatives.
Nearest Center of Gravity; - Delaunay; - Gabriel; - Infinite Strip Band; - Relative Neighborhood; - Sphere of Influence; - Alpha Shape; - Epsilon-Ball; - Lune-based Beta Skeleton;- Circle-based Beta
- 451 (All time)
- 2 (Last 30 days)
- 4.0 / 5
- Community
-
8 Feb 2016

Making Data Analytics for the Mining Industry Simple with MATLAB
Highlights automatically importing assay text data, perform basic statistics & visualization
- 2.5K (All time)
- 3 (Last 30 days)
- 5.0 / 5
- Community
-
1 Sep 2016

Fast Alpha Hulls (alpha shapes in 3d; parfor enabled)
Compute the alpha hulls (exterior and interior) of a set of points.
See also http://www.dylan-muir.com/articles/alpha_hulls/Usage: [triHull, vbOutside, vbInside] = AlphaHull(mfPoints, fAlphaRadius , triDelaunay)This function computes the alpha shape / alpha hulls of
- 2.2K (All time)
- 4 (Last 30 days)
- 3.0 / 5
- Community
-
29 Aug 2017
Find the coordinates of final alpha shape
The code works to find the coordinates of final alpha shape
Extracts 2d boundary coordinates from a set of x/y data points based on ashape package in http://www.mathworks.cn/matlabcentral/fileexchange/6760-ashape-a-pedestrian-alpha-shape-extractor.
- 259 (All time)
- 2 (Last 30 days)
- -- / 5
- Community
-
25 Nov 2013
Anderson-Darling Goodness Of Fit Test to Inverse Gaussian Distbtn
Tests M random samples of N random vars to determine if they are from Inverse Gaussian distbtn.
This program is based on the method published by O'Reilly & Rueda (see program for more details for reference). Confidence level (i.e. alpha value) is chosen,and if the number of AD test stats
- 1.1K (All time)
- 1 (Last 30 days)
- 5.0 / 5
- Community
-
8 May 2009

2D/3D image segmentation toolbox
2D/3D image segmentation using level-set based active contour/surface with AOS scheme
- 35.3K (All time)
- 5 (Last 30 days)
- 4.5 / 5
- Community
-
28 Jan 2013

Live Script that makes a variety of helical-spring alpha shapes, geometry files, and STL files.
This Live script makes a variety of solid helical coils by sweeping a rectangular or elliptical beam cross section through space. The point cloud is wrapped with an alpha shape resulting in faces
- 11 (All time)
- 3 (Last 30 days)
- -- / 5
- Community
-
9 Feb 2026
Betacp of 2D or 3D point set.V = BETAAVOL(x,R) gives the area or volume V of the basic alpha shape
% BetaVOL(x,R,1) plots the Beta shape.%% % 2D Example - C shape% t = linspace(0.6,5.7,500)';% x = 2*[cos(t),sin(t)] + rand(500,2);% subplot(221), Betavol(x,inf,1);% subplot(222
- 27 (All time)
- 2 (Last 30 days)
- -- / 5
- Community
-
23 Mar 2016
- 67 (All time)
- 1 (Last 30 days)
- -- / 5
- Community
-
23 Feb 2021

a fully interactive canvas that provides tools to produce professional-looking schematic diagrams.
- 117 (All time)
- 1 (Last 30 days)
- -- / 5
- Community
-
13 Sep 2022

Efficient Random Variates Generator (from over 50 distributions).
RANDRAWEFFICIENT RANDOM VARIATES GENERATOR (from over 50 distributions):Alpha, Anglit, Antilognormal,Arcsin,Bernoulli, Bessel
- 36.8K (All time)
- 9 (Last 30 days)
- 4.8 / 5
- Community
-
6 Mar 2013

ciplot(lower,upper,x,colour,alpha)
Add alpha color for Confidence Interval Plot of Raymond Reynolds (2006)
I add the fifth parameter, alpha, to let user choice of transparency level.[14/06/2017]: the function should return the handle to give control for fill shape.
- 846 (All time)
- 3 (Last 30 days)
- 4.3 / 5
- Community
-
14 Jun 2017

MATLAB class to fill models with points, build watertight hulls, and derive volume models of a complex surface model for anatomical analysis
and anatomical model with points (grid points) 4. Shrink-Wrap Surfaces: Alpha shape hulls with UI or auto iteration to closed meshes 5. Reference Intersection Support: Identification of reference model
- 10 (All time)
- 1 (Last 30 days)
- -- / 5
- Community
-
10 Dec 2025

Live Script illustrating creation of a 3D solid extruded along a parametric path and saved as an STL file.
Building a solid extrusion model with a closed triangulation from a point cloud fails with Delaney wrapping when the solid is not convex and fails with alpha-shape wrapping when parts of the solid
- 13 (All time)
- 1 (Last 30 days)
- -- / 5
- Community
-
9 Feb 2026
Further tools for analyzing objects in N-dimensional images
A collection of tools to supplement bwpropfilt, bwareaopen, and the like.
intersections with a user-supplied binary mask. Handles N-dimensional images.3. BWLALPHACLOSE: similar to bwconvhull, this will use an alpha shape to seal or reduce concavities in objects (2D and 3D images
- 117 (All time)
- 1 (Last 30 days)
- 5.0 / 5
- Community
-
6 Jul 2025

Aggregate packing generator used for the simulation of aggregate in composites
y=[ymin ymax] is boundaries of the extrusion of the polygonClasses_diameters: Particles classes diameters vector (descendingly)Alpha: Fuller's curve exponent [0.45-0.5].m: Particles shape distribution
- 726 (All time)
- 2 (Last 30 days)
- 5.0 / 5
- Community
-
5 Sep 2024

Explores published asteroid shape models and computes asteroid inertial moments and gravitational fields assuming constant density.
This script explores asteroid shape models derived from public data sources. It illustrates methods to download discrete shape models from the web, explores the surface triangulation methods
- 90 (All time)
- 5 (Last 30 days)
- -- / 5
- Community
-
9 Feb 2026

This function returns information about a triangulation, which may be useful when setting up a partial differential equation problem.
Function analyzeTriangulation() was written to diagnose problems that can occur when using built-in functions alphaShape() and alphaTriangulation(). analyzeTriangulation() works on 2D and 3D
- 0 (All time)
- 0 (Last 30 days)
- -- / 5
- Community
-
10 May 2025

Fast Gradient Vector Flow (GVF)
This package implements the Gradient Vector Flow (GVF) in C++/MEX.
.- **Robustness**: Effective for deformable shape models and image segmentation tasks.- **Ease of Use**: Simple interface with demo script included.## Prerequisites- **MATLAB** or **GNU Octave**.- A C++ compiler
- 3.3K (All time)
- 1 (Last 30 days)
- 5.0 / 5
- Community
-
30 Dec 2025

Panel Method Based 2-D Potential Flow Simulator
This potential flow simulator simulates the flow past bodies of arbitrary shape including airfoils.
This potential flow simulator simulates the flow past bodies of arbitrary shape including airfoils. With this simulator, we can do the following tasks, * Compute and plot the Velocity Vector Plot of
- 33.9K (All time)
- 17 (Last 30 days)
- 4.3 / 5
- Community
-
8 Mar 2021

Least squares spline modeling using shape primitives
, with a caveat. Splines offer tremendous flexibility to build a curve in any shape or form. They can nicely fit almost any set of data you will throw at them. This same flexibility is their downfall at
- 28.6K (All time)
- 31 (Last 30 days)
- 5.0 / 5
- Community
-
16 Apr 2017

fits different theoretical variograms to an experimental variogram
with different exponents. Supply the exponent alpha (<2) as an additional pn,pv-pair 'stablealpha',alpha (default = 1.5).'matern' -- Matern model. Requires an additional pn,pv pair. 'nu',nu (shape
- 12.7K (All time)
- 12 (Last 30 days)
- 4.8 / 5
- Community
-
14 Oct 2010

Aggregate Packing Generator with Thick Fibers
Aggregate packing generator with fibers used for the simulation of aggregate and fibers in composites
Plot_Sieve(Classes,x,y,z,Classes_diameters,Alpha,Particle_ratio)Plots generated sieve curve.3-function Ellipsoids=Particles_Distribution(Classes,x,y,z,er)Generates aggregate with ellipsoids shapes4-function Plot_Ellipsoids(Ellipsoids,x,y,z)Plots ellipsoids5-function
- 377 (All time)
- 2 (Last 30 days)
- 5.0 / 5
- Community
-
7 Sep 2024
barycentric_coordinates will give the coordinates alpha, beta ,gama of the matrix face_point.
face_point is the point [x,y]' from the mean shape of the face. dt is 3 by 2 matrix that will have the coordinates corresponding 2 the vertices of a triangle. for eg for a triangle with vertices
- 277 (All time)
- 1 (Last 30 days)
- 5.0 / 5
- Community
-
21 May 2013

Aggregate Packing Generator with Fibers
Aggregate packing generator with fibers used for the simulation of aggregate and fibers in composites
Classes=Particles_Generation(x,y,z,Classes_diameters,Alpha,m,Particle_ratio)Generates aggregates according to Fuller's curve.2-function Plot_Sieve(Classes,x,y,z,Classes_diameters,Alpha,Particle_ratio)Plots generated sieve curve.3-function
- 302 (All time)
- 1 (Last 30 days)
- 5.0 / 5
- Community
-
9 Sep 2024

Generate Abaqus Mesh for 2D Mesoscale Geometries
Generates Abaqus mesh for 2D mesoscale geometries
of the extrusion of the polygonClasses_diameters: Particles classes diameters vector (descendingly)Alpha: Fuller's curve exponent [0.45-0.5].m: Particles shape distribution factor. m=1 for spheres and
- 301 (All time)
- 2 (Last 30 days)
- 5.0 / 5
- Community
-
26 Aug 2024

Planar Cosserat rod
rod2d handle object is used for computation of planar Cosserat rod, i.e. extensible and shearable rod, which is based on the analytical solution given in [1]. The initial shape of the rod can be a
- 438 (All time)
- 3 (Last 30 days)
- 5.0 / 5
- Community
-
9 Dec 2019

Generate an Animated Heart Shape GIF in MATLAB
This is a MATLAB code that generates an animated GIF of a heart shape.
represent the heart shape using parametric equations. Next, the code sets up the animation by defining the number of frames (nFrames) and creating a sequence of alpha values that will be used to change the
- 39 (All time)
- 1 (Last 30 days)
- 5.0 / 5
- Community
-
1 Aug 2023

Polygonal (radar) plot with mean and standard deviation (or error) values
Function polygonplot plots a kind of radial plot whose shape is a N-polygon, depending on the size of the data. It have also provide users the functionality of plotting a shaded error area if the
- 499 (All time)
- 3 (Last 30 days)
- 5.0 / 5
- Community
-
29 Jan 2020

Aggregate 2D Packing Generator
Aggregate 2D packing generator used for the simulation of aggregate in composites
section.Classes_diameters: Particles classes diameters vector (descendingly)Alpha: Fuller's curve exponent [0.45-0.5].m: Particles shape distribution factor. m=1 for circles and m>>1 for elongated ellipses
- 290 (All time)
- 2 (Last 30 days)
- -- / 5
- Community
-
30 Aug 2024

Weighted Absorption Coefficient
Resolves weighted absorption coefficient (aw) according to EN ISO 16654
Determine alpha w (aw) and also the shape indicator from 1/1 octave band alpha values (a).
- 28 (All time)
- 1 (Last 30 days)
- -- / 5
- Community
-
20 Feb 2023

MATLAB Support for MinGW-w64 C/C++/Fortran Compiler
Install the MinGW-w64 C/C++/Fortran compiler for Windows
- 1.2M (All time)
- 7.7K (Last 30 days)
- 2.9 / 5
- MathWorks
-
26 Jan 2026

Aggregate Packing Generator with STL File
Aggregate packing generator used for the simulation of aggregate in composites and creates STL file
Aggregate2STL.m:stlwrite(Filename,FF,VV); with:TR = triangulation(FF,VV); stlwrite(TR,Filename);functions:-1-function Classes=Particles_Generation(x,y,z,Classes_diameters,Alpha,m,Particle_ratio)Generates aggregates according to Fuller
- 62 (All time)
- 7 (Last 30 days)
- -- / 5
- Community
-
26 Sep 2024

- 6.2K (All time)
- 9 (Last 30 days)
- 5.0 / 5
- Community
-
14 Sep 2023

Generate Abaqus Mesh for 3D Mesoscale Geometries
Generates Abaqus mesh for 3D mesoscale geometries
Plot_Sieve(Classes,x,y,z,Classes_diameters,Alpha,Particle_ratio)Plots generated sieve curve.3-function Ellipsoids=Particles_Distribution(Classes,x,y,z,er)Generates aggregate with ellipsoids shapes4-function Plot_Ellipsoids(Ellipsoids,x,y,z)Plots
- 291 (All time)
- 4 (Last 30 days)
- -- / 5
- Community
-
30 Aug 2024

Aggregate Packing Generator with Thick Fibers and STL File
Aggregate packing generator with fibers used for the simulation of aggregate and fibers in composites. It also creates three STL files.
Classes=Particles_Generation(x,y,z,Classes_diameters,Alpha,m,Particle_ratio)Generates aggregates according to Fuller's curve.2-function Plot_Sieve(Classes,x,y,z,Classes_diameters,Alpha,Particle_ratio)Plots generated sieve curve.3-function
- 60 (All time)
- 3 (Last 30 days)
- -- / 5
- Community
-
26 Sep 2024
Beta-binomial probability distribution function.
distribution is used to model the number of successes in n binomial trials when the probability of success p is a Beta(a,b) random variable. The extreme flexibility of the shape of the Beta distribution means
- 1.6K (All time)
- 3 (Last 30 days)
- -- / 5
- Community
-
30 Sep 2009

Alphanumeric sort of filenames or filepaths, with customizable number format.
- 36.7K (All time)
- 133 (Last 30 days)
- 5.0 / 5
- Community
-
10 Apr 2026
- 6.8K (All time)
- 5 (Last 30 days)
- 4.8 / 5
- Community
-
19 Jan 2025

Percolation of Fibers with Aggregate
Determines the percolation of fibers in a box (cuboid) containing aggregate
Classes_diameters: Particles classes diameters vector (descendingly)Alpha: Fuller's curve exponent [0.45-0.5].m: Particles shape distribution factor. m=1 for spheres and m>>1 for elongated ellipsoid shapes
- 84 (All time)
- 3 (Last 30 days)
- -- / 5
- Community
-
15 May 2025

Alphanumeric row sort of a cell/string/categorical/table array, with customizable number format.
- 2.3K (All time)
- 9 (Last 30 days)
- 5.0 / 5
- Community
-
10 Apr 2026

Customizable Natural-Order Sort
Alphanumeric sort of a cell/string/categorical array, with customizable number format.
- 5.8K (All time)
- 19 (Last 30 days)
- 5.0 / 5
- Community
-
10 Apr 2026

A unified MATLAB project combining multiple anatomy‑analysis classes into a comprehensive anatomy modeling workflow.
, transformation, mesh repair, hole filling, shrink wrap, alpha shape, intersection, sphere approximation, clumped spheres, volume analysis, rigid body alignment, Kabsch algorithm, distance mapping, boundary
- 8 (All time)
- 1 (Last 30 days)
- -- / 5
- Community
-
10 Dec 2025

Deep Learning Toolbox Interface for alpha-beta-CROWN Verifier
Verify robustness properties of PyTorch and ONNX Deep Neural Networks using the α,β-CROWN (alpha-beta-CROWN) Verifier
The Deep Learning Toolbox™ Interface for alpha-beta-CROWN Verifier enables verification of neural networks in ONNX and PyTorch formats, including computation of network bounds, robustness of
- 29 (All time)
- 6 (Last 30 days)
- -- / 5
- MathWorks
-
26 Jan 2026
Fuzzy Control of Multilayer Backpropagation Neural Network
Implementation of Fuzzy Control of Multilayer Backpropagation Neural Network
heuristic solution and depending on the shape of the error surface.The central idea behind the fuzzy control of backpropagation is the implementation of heuristics in the form of fuzzy if then rules. Which is
- 400 (All time)
- 2 (Last 30 days)
- -- / 5
- Community
-
15 Feb 2020
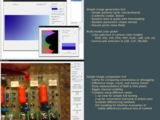
MATLAB Image Manipulation Toolbox
generationImage viewer with support for alpha and 4D image browsingImage blending, compositing and masking toolsColor adjustment in various color modelsContrast or chroma enhancement via levels/curves tool (RGB or
- 9.4K (All time)
- 88 (Last 30 days)
- 5.0 / 5
- Community
-
4 Jul 2024

Fortran 95 Interface to MATLAB API with extras!
This is the one you have been waiting for, a clean interface using assumed shape Fortran pointers.
that work with assumed shape Fortran Pointers. Functions are available to, in one line:-Get shaped pointers into the data area of an mxArray-Get shaped pointers that point to a copy of the data area of
- 2.9K (All time)
- 3 (Last 30 days)
- 5.0 / 5
- Community
-
11 Dec 2011
MAT2TILES: divide array into equal-sized sub-arrays
Splits an array of any dimension into cell array of equal sized chunks.
- 3.5K (All time)
- 4 (Last 30 days)
- 4.6 / 5
- Community
-
24 Sep 2017

with this you can recognize many shape;but only symetrical shape
with this you can recognize many shape;but only symetrical shape,for example you can improve this for recognize star,polygon if you want
- 9.5K (All time)
- 1 (Last 30 days)
- 4.4 / 5
- Community
-
11 Jul 2008

Multiple auto-generated lorentzian/gaussian peak Fit
Fits n peaks with symmetric/asymmetric lorentzian/gaussian line shapes. Output yields fit coefficients, erros and every single contribution.
more options. Matlab Curve Fitting and Symbolic Math toolboxes are required. The main function 'multiPeakFit.m' executes the fit to a given dataset. Included line shape types are:asymmetric lorentzian
- 436 (All time)
- 5 (Last 30 days)
- -- / 5
- Community
-
12 Feb 2025

PV system with various MPPT (P&O-INC-ANN-FLC-PSO)
Maximum power point tracking (MPPT) using different algorithms
- 10.4K (All time)
- 368 (Last 30 days)
- 4.6 / 5
- Community
-
30 Mar 2024
Shapiro-Wilk and Shapiro-Francia normality tests.
Shapiro-Wilk & Shapiro-Francia parametric hypothesis test of composite normality.
- 33.3K (All time)
- 213 (Last 30 days)
- 4.9 / 5
- Community
-
18 Jun 2014
Mathematica Symbolic Toolbox for MATLAB--Version 2.0
A symbolic toolbox for MATLAB based on Mathematica.
- 30.5K (All time)
- 113 (Last 30 days)
- 5.0 / 5
- Community
-
10 Jun 2010

Analyze N-dimensional Convex Polyhedra
Find vertex or (in)equality forms of convex polyhedra in R^n (for n not super large). Also, compute their intersections and unions.
column vectors, respectively. The (in)equality representation expresses the polyhedron as the intersection of two regions. One region is a solid N-dimensional shape, described by the inequalities, while
- 6.5K (All time)
- 16 (Last 30 days)
- 4.9 / 5
- Community
-
21 Mar 2021

Shape recognition using 2-D correlation
Shape recognition using 2-D correlation. Input images are read from webcam.
Application of image processing that captures an image from an integrated or external camera and proceeds to recognize shapes as rectangle, circle, star and triangle. The recognition is based on the
- 5.4K (All time)
- 3 (Last 30 days)
- 5.0 / 5
- Community
-
29 Jan 2015

MTIMESX - Fast Matrix Multiply with Multi-Dimensional Support
Beats MATLAB 300% - 400% in some cases ... really!
- 19.4K (All time)
- 9 (Last 30 days)
- 4.6 / 5
- Community
-
23 Feb 2011

cprintf - display formatted colored text in Command Window
Displays sprintf-formatted strings in the Command Window using the specified color/underline/bold style
- 29.6K (All time)
- 118 (Last 30 days)
- 4.9 / 5
- Community
-
22 Apr 2026