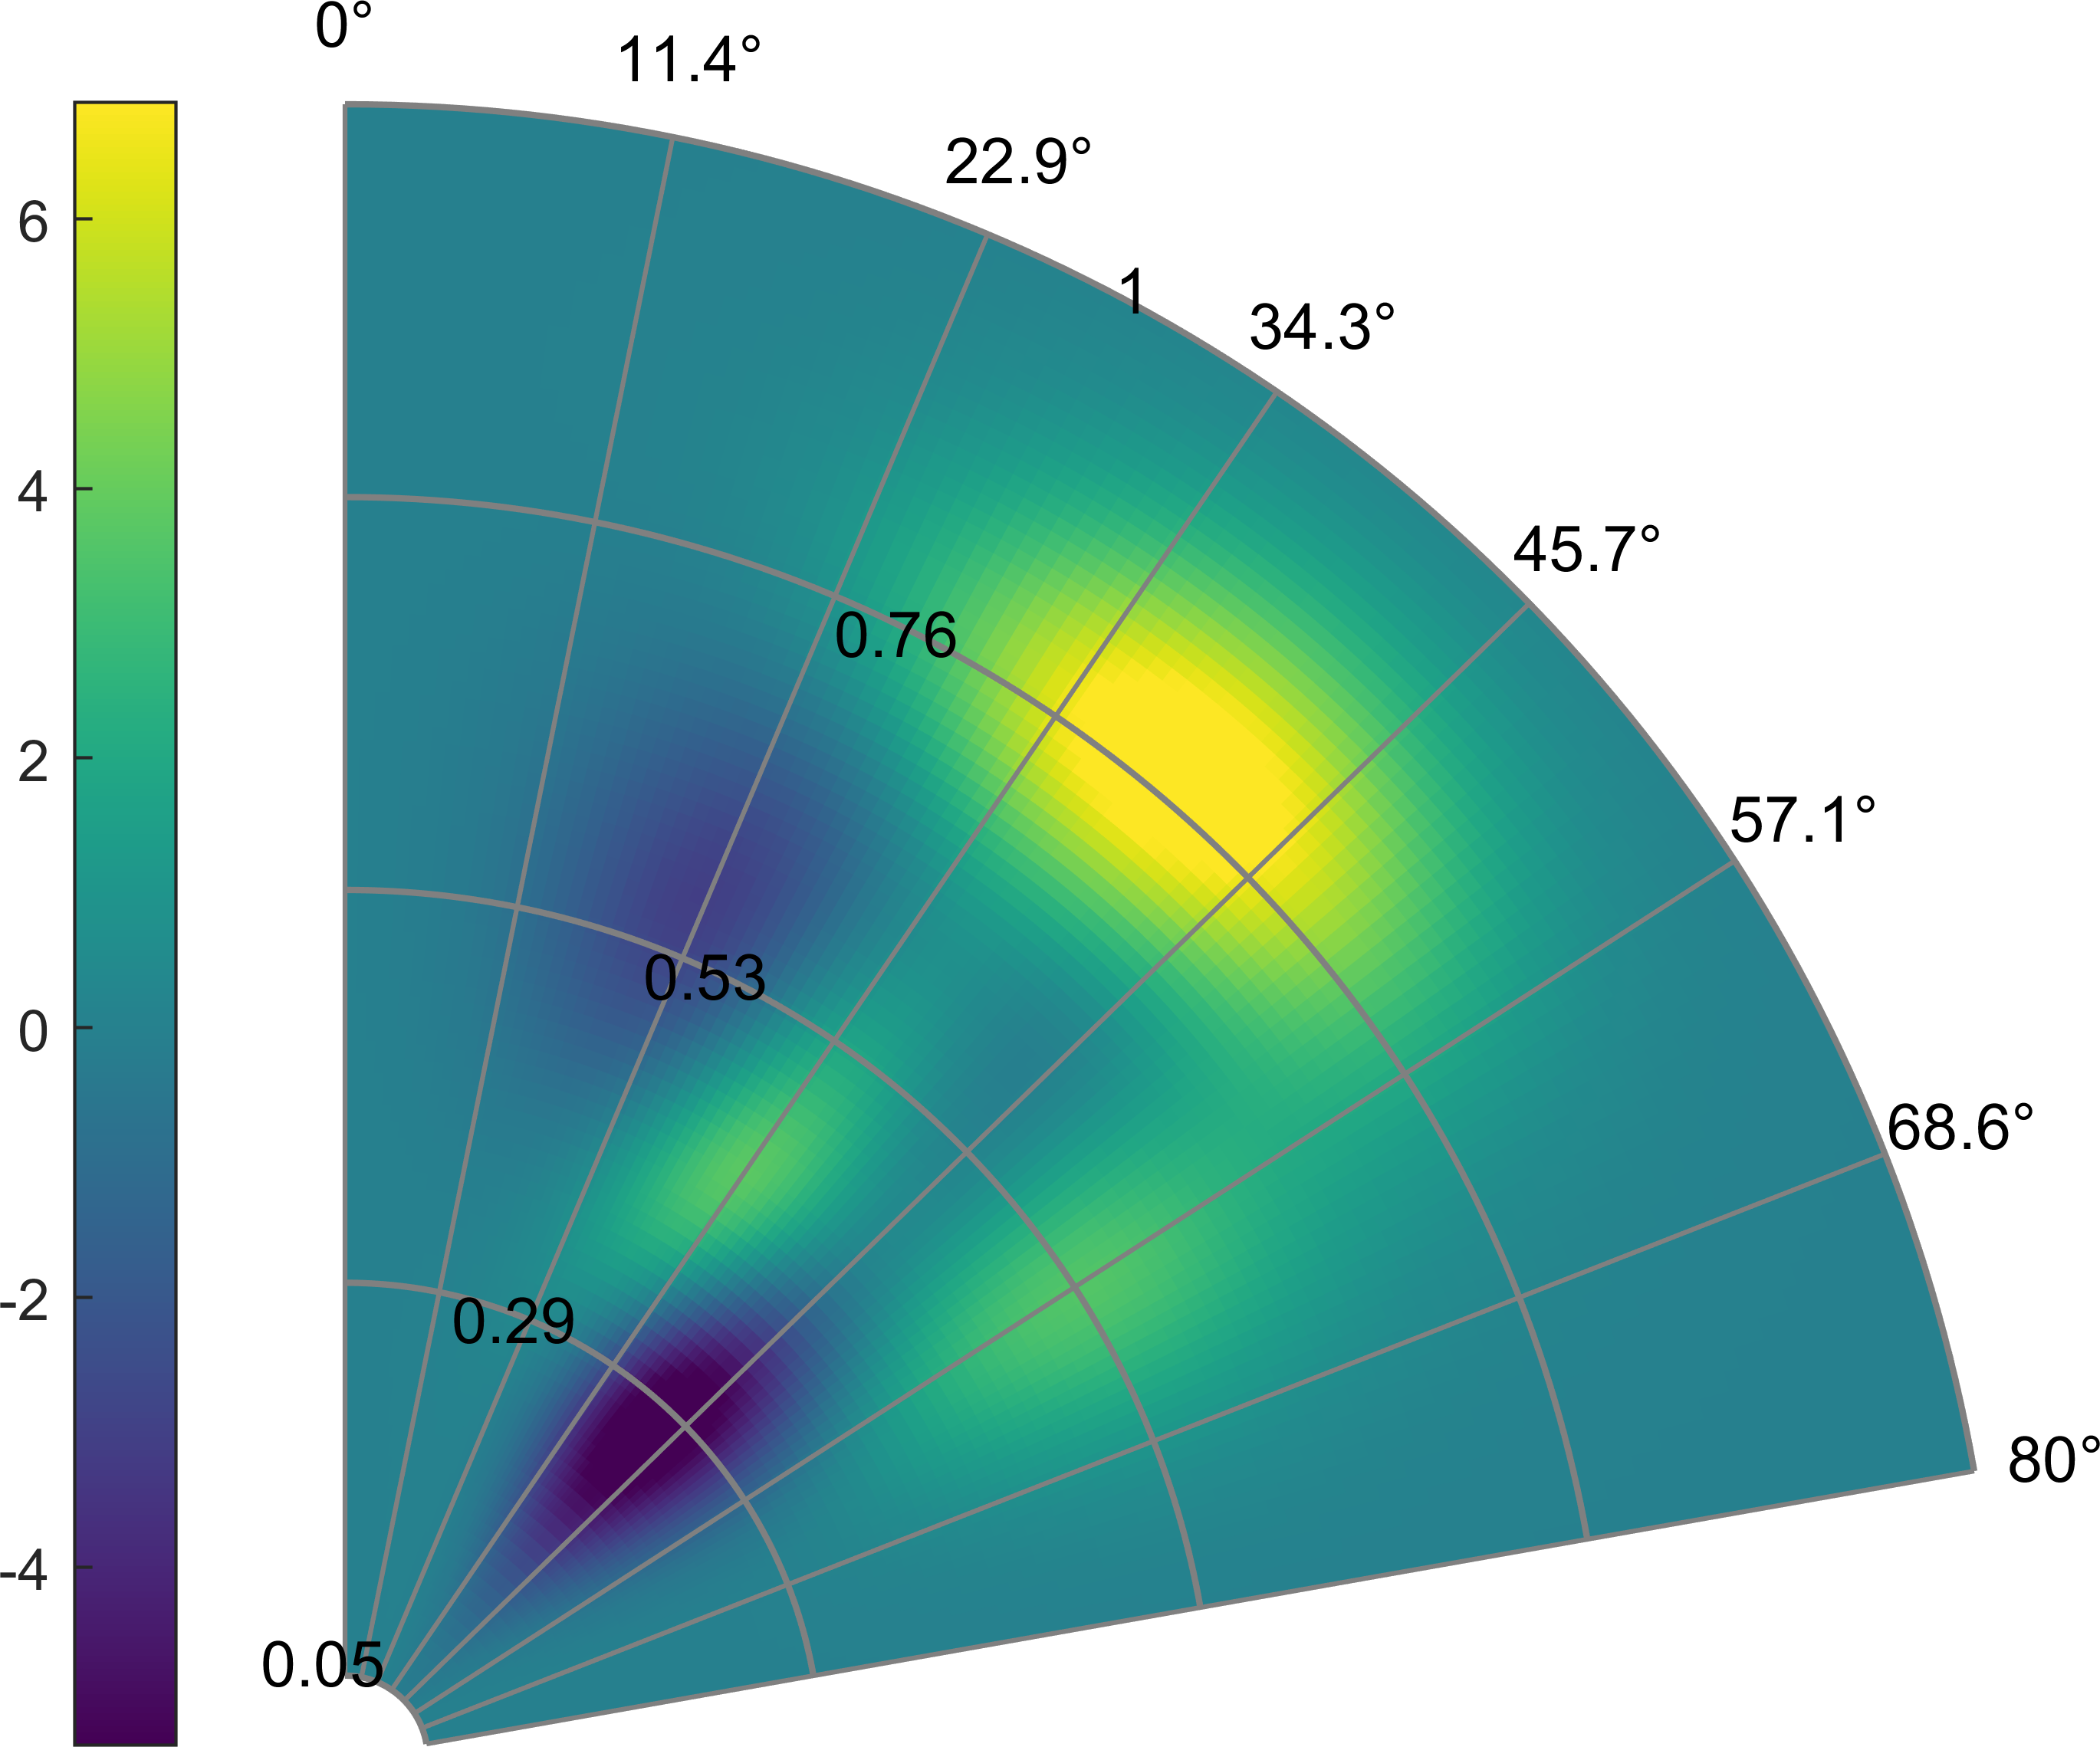
pcolor in polar coordinates
polarPcolor draws a pseudocolor plot in polar coordinates with a polar grid.
You are now following this Submission
- You will see updates in your followed content feed
- You may receive emails, depending on your communication preferences
Cite As
Cheynet, E. ECheynet/PolarPcolor v3.8. Zenodo, 2020, doi:10.5281/ZENODO.3774156.
General Information
- Version 3.11.0 (1.02 MB)
-
 View License on GitHub
MATLAB Release Compatibility
- Compatible with R2014b to R2018a
Platform Compatibility
- Windows
- macOS
- Linux
| Version | Published | Release Notes | Action |
|---|---|---|---|
| 3.11.0 | See release notes for this release on GitHub: https://github.com/ECheynet/polarPcolor/releases/tag/v3.11 |
||
| 3.10.0 | See release notes for this release on GitHub: https://github.com/ECheynet/polarPcolor/releases/tag/v3.10 |
||
| 3.9.0 | See release notes for this release on GitHub: https://github.com/ECheynet/polarPcolor/releases/tag/v3.9 |
||
| 3.8.0 | See release notes for this release on GitHub: https://github.com/ECheynet/polarPcolor/releases/tag/v3.8 |
||
| 3.6.2 | The option "Origin" has been updated and is named now "autoOrigin" |
||
| 3.6.1 | typos |
||
| 3.6.1-0 | Update of the example + more robust definition of "Rmin", which should not interact with the option "CirclesPos". |
||
| 3.6.0 | Three new options have been added:
|
||
| 3.5.0 | Added project website |
||
| 3.5.0-2 | Description |
||
| 3.5.0-1 | Updated the screenshot |
||
| 3.5.0-0 | Update the example file and added an option to change the radial tick label ('Rticklabel') |
||
| 3.4.0 | The bug related to the option "Rscale" has been correct (hopefully). A new option "Origin" has been added to let the user choose between a polar plot centred around 0 or min(R). The circles and spokes are now drawn as solid lines instead of dots. |
||
| 3.3.0 | Correction of a bug for the "Rscale" option |
||
| 3.2.1 | The html example is removed as the LiveScript file fulfils the same role |
||
| 3.2.1-2 | typo |
||
| 3.2.1-1 | Added HTML example |
||
| 3.2.1-0 | Added LiveScript example |
||
| 3.2.0 | Added the possibility to include a log scale on the radial axis (see Example.m) + correction of a minor bug when theta and R have the same size. |
||
| 3.1.0 | typo |
||
| 3.0.0 | - automatic scaling of colorbar + new example + multiple options are added |
||
| 2.1.0 | - typo |
||
| 2.0.0 | Description |
||
| 1.7.0 | - |
||
| 1.6.0 | - picture updated
|
||
| 1.5.0 | - example updated
|
||
| 1.4.0 | example corrected |
||
| 1.3.0 | - |
||
| 1.2.0 | tags modification |
||
| 1.1.0 | More accurate description added |
||
| 1.0.0 |

