Results for

This cheat sheet is here:
reference:
- https://github.com/peijin94/matlabPlotCheatsheet
- https://github.com/mathworks/visualization-cheat-sheet
- https://www.mathworks.com/products/matlab/plot-gallery.html
- https://www.mathworks.com/help/matlab/release-notes.html
MATLAB used to have official visualization-cheat-sheet, but there have been quite a few new updates in MATLAB versions recently. Therefore, I made my own cheat sheet and marked the versions of each new thing that were released :


Happy Pi Day!
3.14 π Day has arrived, and this post provides some very cool pi implementations and complete MATLAB code.
Firstly, in order to obtain the first n decimal places of pi, we need to write the following code (to prevent inaccuracies, we need to take a few more tails and perform another operation of taking the first n decimal places when needed):
function Pi=getPi(n)
if nargin<1,n=3;end
Pi=char(vpa(sym(pi),n+10));
Pi=abs(Pi)-48;
Pi=Pi(3:n+2);
end
With this function to obtain the decimal places of pi, our visualization journey has begun~Step by step, from simple to complex~(Please try to use newer versions of MATLAB to run, at least R17b)
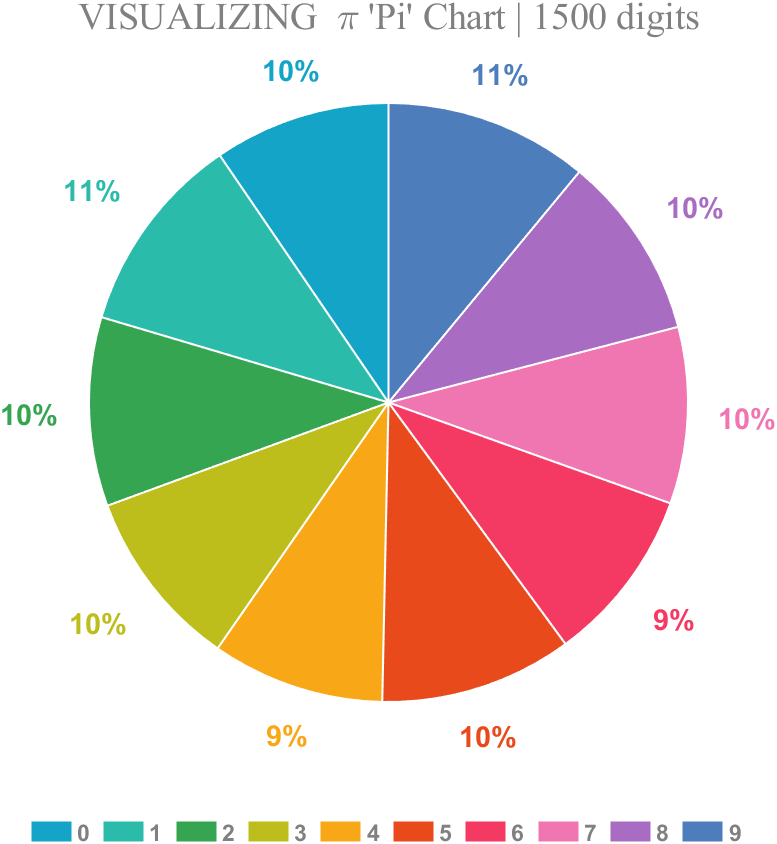
1 Pie chart
Just calculate the proportion of each digit to the first 1500 decimal places:
% 获取pi前1500位小数
Pi=getPi(1500);
% 统计各个数字出现次数
numNum=find([diff(sort(Pi)),1]);
numNum=[numNum(1),diff(numNum)];
% 配色列表
CM=[20,164,199;43,187,170;53,165,81;189,190,28;248,167,22;
232,74,27;244,57,99;240,118,177;168,109,195;78,125,187]./255;
% 绘图并修饰
pieHdl=pie(numNum);
set(gcf,'Color',[1,1,1],'Position',[200,100,620,620]);
for i=1:2:20
pieHdl(i).EdgeColor=[1,1,1];
pieHdl(i).LineWidth=1;
pieHdl(i).FaceColor=CM((i+1)/2,:);
end
for i=2:2:20
pieHdl(i).Color=CM(i/2,:);
pieHdl(i).FontWeight='bold';
pieHdl(i).FontSize=14;
end
% 绘制图例并修饰
lgdHdl=legend(num2cell('0123456789'));
lgdHdl.FontWeight='bold';
lgdHdl.FontSize=11;
lgdHdl.TextColor=[.5,.5,.5];
lgdHdl.Location='southoutside';
lgdHdl.Box='off';
lgdHdl.NumColumns=10;
lgdHdl.ItemTokenSize=[20,15];
title("VISUALIZING \pi 'Pi' Chart | 1500 digits",'FontSize',18,...
'FontName','Times New Roman','Color',[.5,.5,.5])
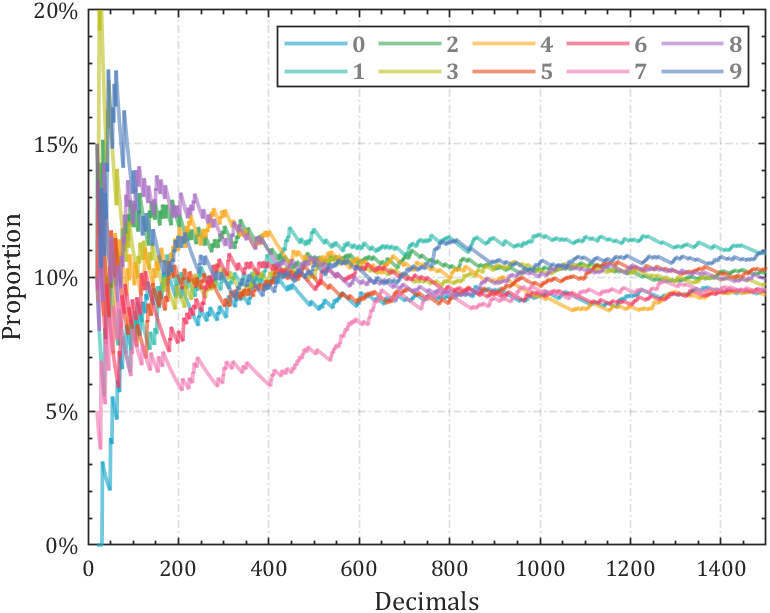
2 line chart
Calculate the change in the proportion of each number:
% 获取pi前1500位小数
Pi=getPi(1500);
% 计算比例变化
Ratio=cumsum(Pi==(0:9)',2);
Ratio=Ratio./sum(Ratio);
D=1:length(Ratio);
% 配色列表
CM=[20,164,199;43,187,170;53,165,81;189,190,28;248,167,22;
232,74,27;244,57,99;240,118,177;168,109,195;78,125,187]./255;
hold on
% 循环绘图
for i=1:10
plot(D(20:end),Ratio(i,20:end),'Color',[CM(i,:),.6],'LineWidth',1.8)
end
% 坐标区域修饰
ax=gca;box on;grid on
ax.YLim=[0,.2];
ax.YTick=0:.05:.2;
ax.XTick=0:200:1400;
ax.YTickLabel={'0%','5%','10%','15%','20%'};
ax.XMinorTick='on';
ax.YMinorTick='on';
ax.LineWidth=.8;
ax.GridLineStyle='-.';
ax.FontName='Cambria';
ax.FontSize=11;
ax.XLabel.String='Decimals';
ax.YLabel.String='Proportion';
ax.XLabel.FontSize=13;
ax.YLabel.FontSize=13;
% 绘制图例并修饰
lgdHdl=legend(num2cell('0123456789'));
lgdHdl.NumColumns=5;
lgdHdl.FontWeight='bold';
lgdHdl.FontSize=11;
lgdHdl.TextColor=[.5,.5,.5];
3 stacked area diagram
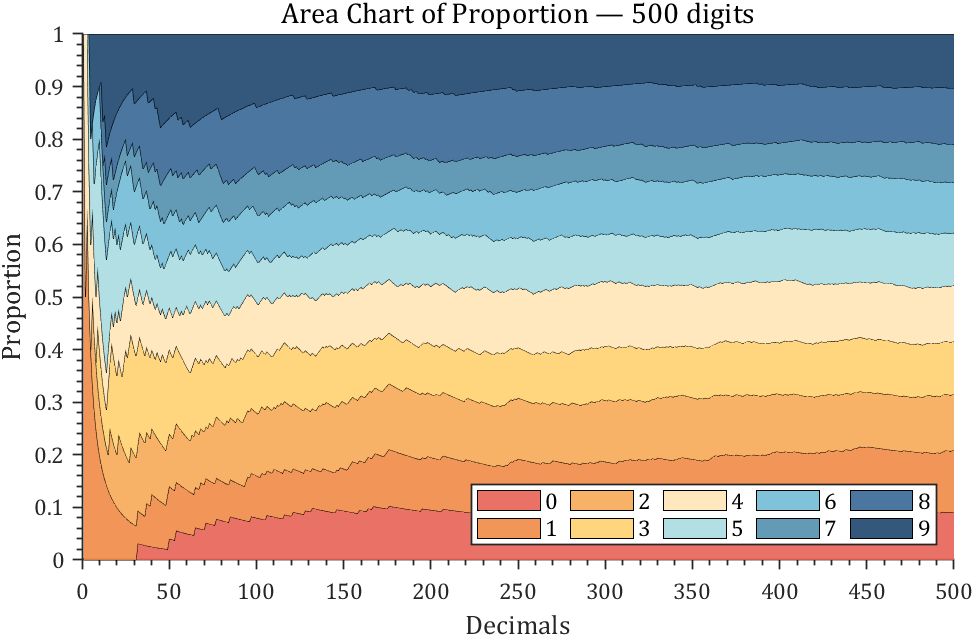
% 获取pi前500位小数
Pi=getPi(500);
% 计算比例变化
Ratio=cumsum(Pi==(0:9)',2);
Ratio=Ratio./sum(Ratio);
% 配色列表
CM=[231,98,84;239,138,71;247,170,88;255,208,111;255,230,183;
170,220,224;114,188,213;82,143,173;55,103,149;30,70,110]./255;
% 绘制堆叠面积图
hold on
areaHdl=area(Ratio');
for i=1:10
areaHdl(i).FaceColor=CM(i,:);
areaHdl(i).FaceAlpha=.9;
end
% 图窗和坐标区域修饰
set(gcf,'Position',[200,100,720,420]);
ax=gca;
ax.YLim=[0,1];
ax.XMinorTick='on';
ax.YMinorTick='on';
ax.LineWidth=.8;
ax.FontName='Cambria';
ax.FontSize=11;
ax.TickDir='out';
ax.XLabel.String='Decimals';
ax.YLabel.String='Proportion';
ax.XLabel.FontSize=13;
ax.YLabel.FontSize=13;
ax.Title.String='Area Chart of Proportion — 500 digits';
ax.Title.FontSize=14;
% 绘制图例并修饰
lgdHdl=legend(num2cell('0123456789'));
lgdHdl.NumColumns=5;
lgdHdl.FontSize=11;
lgdHdl.Location='southeast';
4 connected stacked bar chart
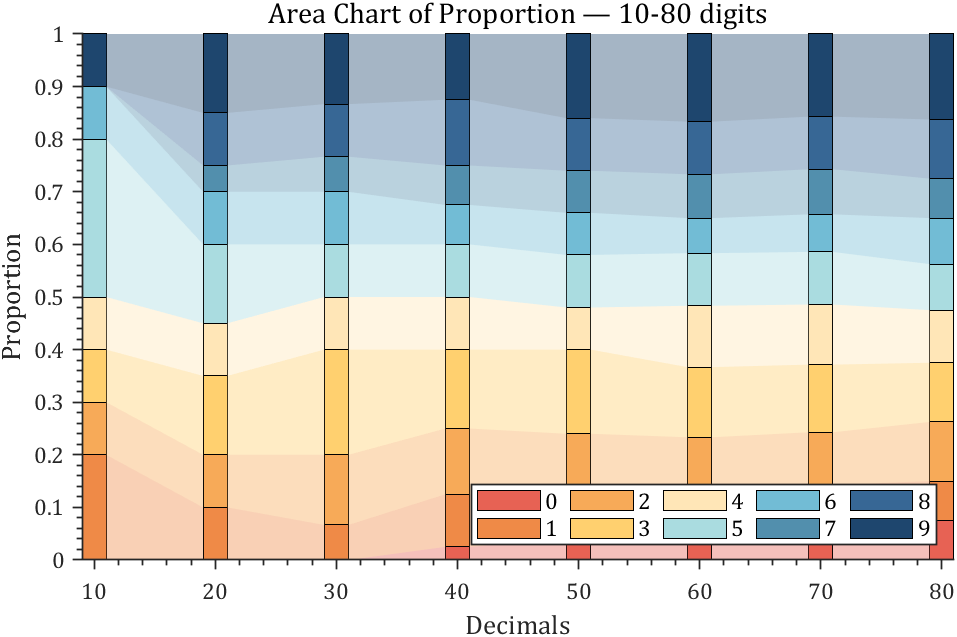
% 获取pi前100位小数
Pi=getPi(100);
% 计算比例变化
Ratio=cumsum(Pi==(0:9)',2);
Ratio=Ratio./sum(Ratio);
X=Ratio(:,10:10:80)';
barHdl=bar(X,'stacked','BarWidth',.2);
CM=[231,98,84;239,138,71;247,170,88;255,208,111;255,230,183;
170,220,224;114,188,213;82,143,173;55,103,149;30,70,110]./255;
for i=1:10
barHdl(i).FaceColor=CM(i,:);
end
% 以下是生成连接的部分
hold on;axis tight
yEndPoints=reshape([barHdl.YEndPoints]',length(barHdl(1).YData),[])';
zeros(1,length(barHdl(1).YData));
yEndPoints=[zeros(1,length(barHdl(1).YData));yEndPoints];
barWidth=barHdl(1).BarWidth;
for i=1:length(barHdl)
for j=1:length(barHdl(1).YData)-1
y1=min(yEndPoints(i,j),yEndPoints(i+1,j));
y2=max(yEndPoints(i,j),yEndPoints(i+1,j));
if y1*y2<0
ty=yEndPoints(find(yEndPoints(i+1,j)*yEndPoints(1:i,j)>=0,1,'last'),j);
y1=min(ty,yEndPoints(i+1,j));
y2=max(ty,yEndPoints(i+1,j));
end
y3=min(yEndPoints(i,j+1),yEndPoints(i+1,j+1));
y4=max(yEndPoints(i,j+1),yEndPoints(i+1,j+1));
if y3*y4<0
ty=yEndPoints(find(yEndPoints(i+1,j+1)*yEndPoints(1:i,j+1)>=0,1,'last'),j+1);
y3=min(ty,yEndPoints(i+1,j+1));
y4=max(ty,yEndPoints(i+1,j+1));
end
fill([j+.5.*barWidth,j+1-.5.*barWidth,j+1-.5.*barWidth,j+.5.*barWidth],...
[y1,y3,y4,y2],barHdl(i).FaceColor,'FaceAlpha',.4,'EdgeColor','none');
end
end
% 图窗和坐标区域修饰
set(gcf,'Position',[200,100,720,420]);
ax=gca;box off
ax.YLim=[0,1];
ax.XMinorTick='on';
ax.YMinorTick='on';
ax.LineWidth=.8;
ax.FontName='Cambria';
ax.FontSize=11;
ax.TickDir='out';
ax.XTickLabel={'10','20','30','40','50','60','70','80'};
ax.XLabel.String='Decimals';
ax.YLabel.String='Proportion';
ax.XLabel.FontSize=13;
ax.YLabel.FontSize=13;
ax.Title.String='Area Chart of Proportion — 10-80 digits';
ax.Title.FontSize=14;
% 绘制图例并修饰
lgdHdl=legend(barHdl,num2cell('0123456789'));
lgdHdl.NumColumns=5;
lgdHdl.FontSize=11;
lgdHdl.Location='southeast';
5 bichord chart
Need to use this tool:
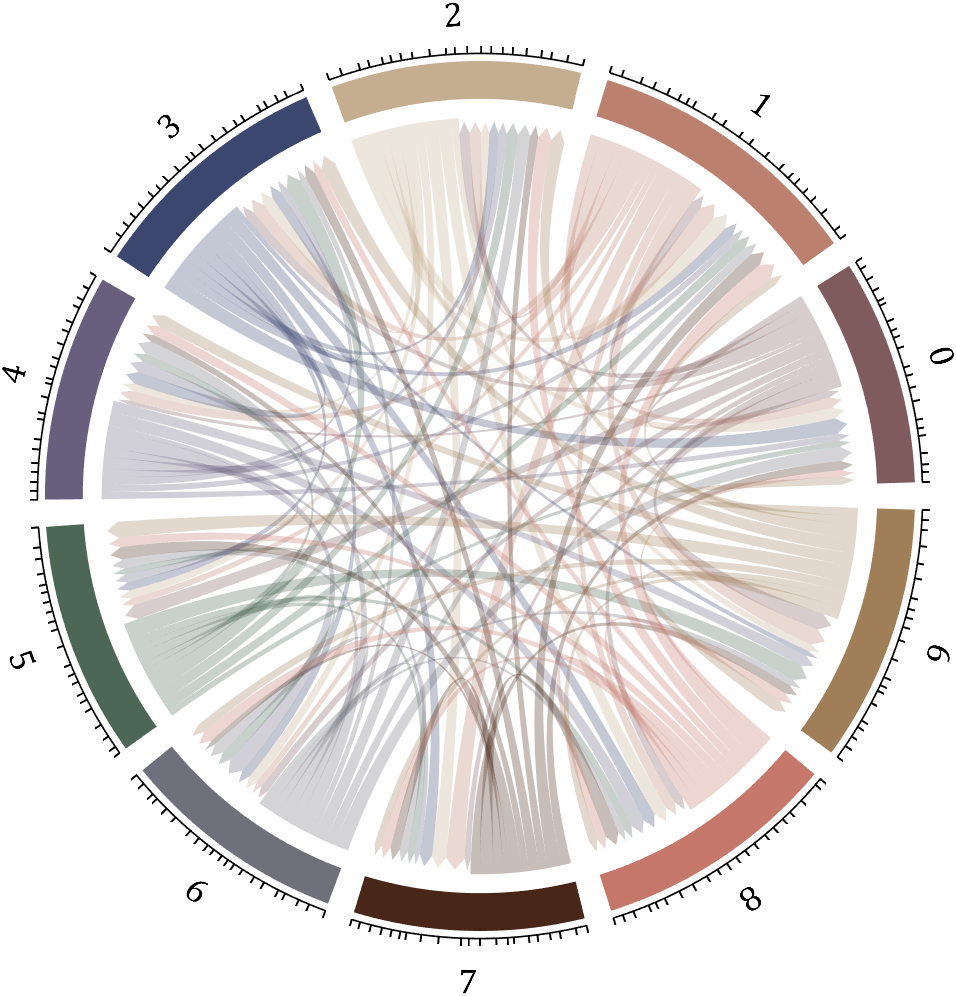
% 构建连接矩阵
dataMat=zeros(10,10);
Pi=getPi(1001);
for i=1:1000
dataMat(Pi(i)+1,Pi(i+1)+1)=dataMat(Pi(i)+1,Pi(i+1)+1)+1;
end
BCC=biChordChart(dataMat,'Arrow','on','Label',num2cell('0123456789'));
BCC=BCC.draw();
% 添加刻度
BCC.tickState('on')
% 修改字体,字号及颜色
BCC.setFont('FontName','Cambria','FontSize',17)
set(gcf,'Position',[200,100,820,820]);
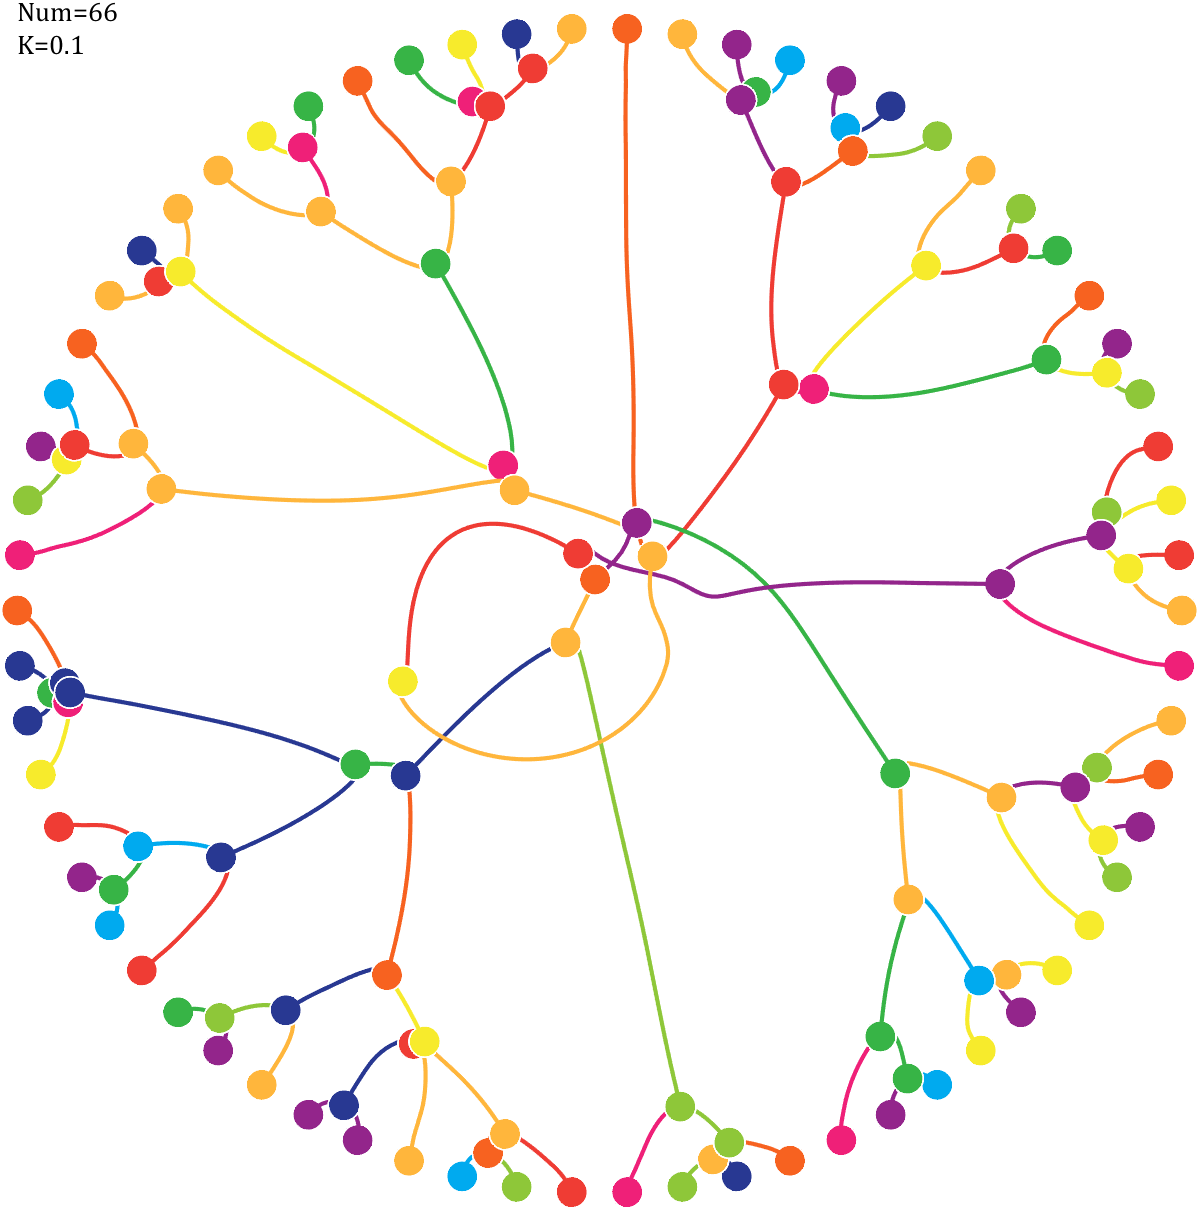
6 Gravity simulation diagram
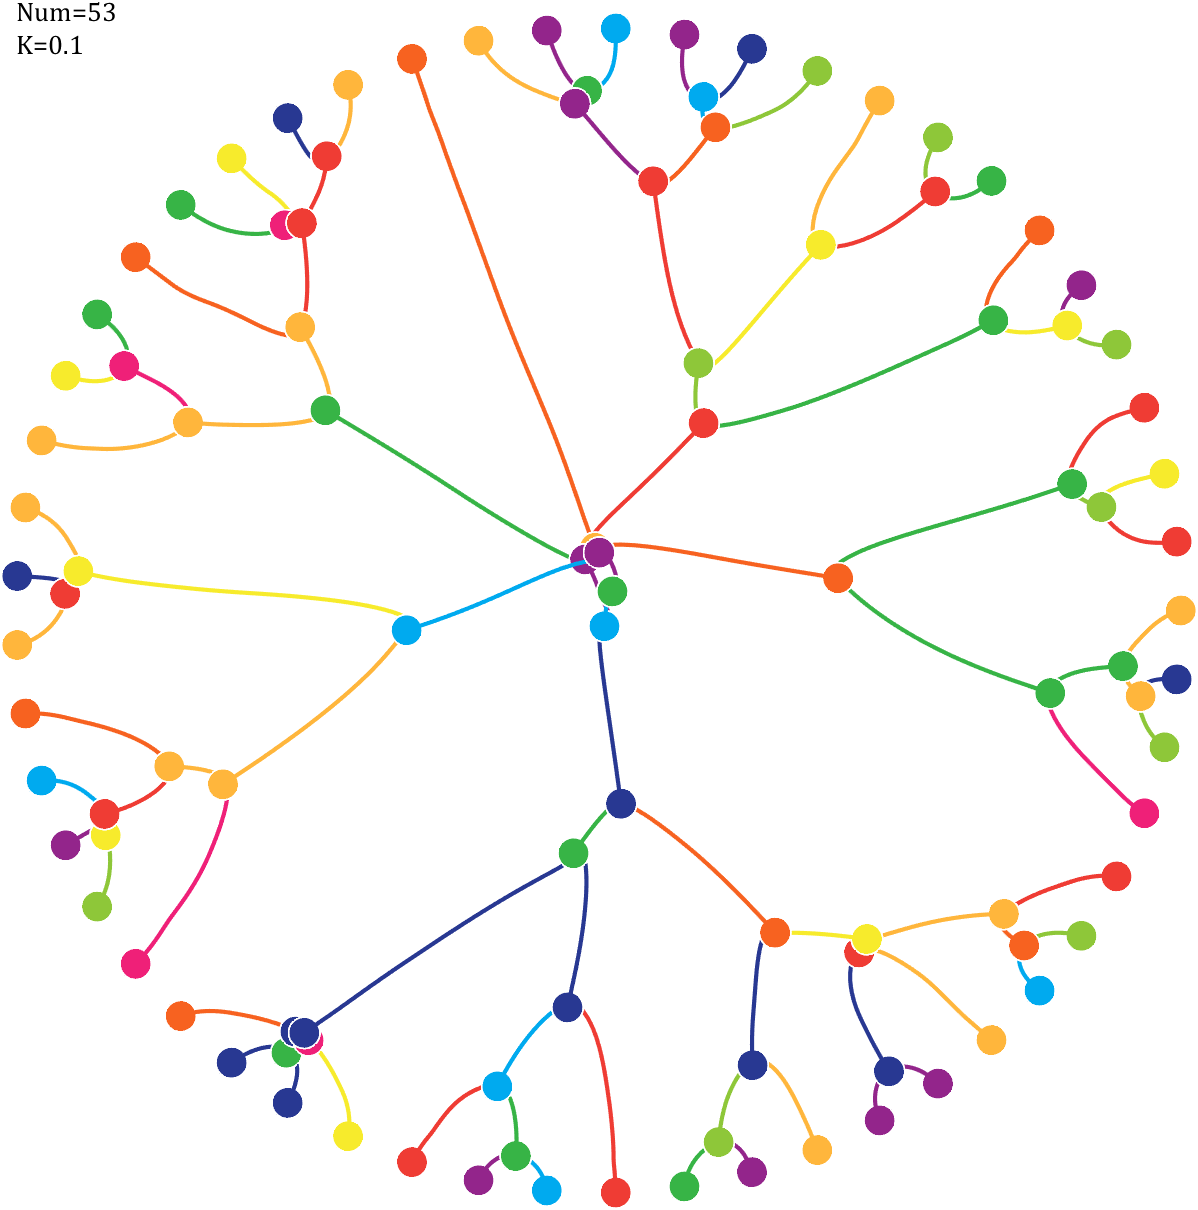
Imagine each decimal as a small ball with a mass of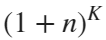
For example, if , the weight of ball 0 is 1, ball 9 is 1.2589, the initial velocity of the ball is 0, and it is attracted by other balls. Gravity follows the inverse square law, and if the balls are close enough, they will collide and their value will become
After adding, take the mod, add the velocity direction proportionally, and recalculate the weight.
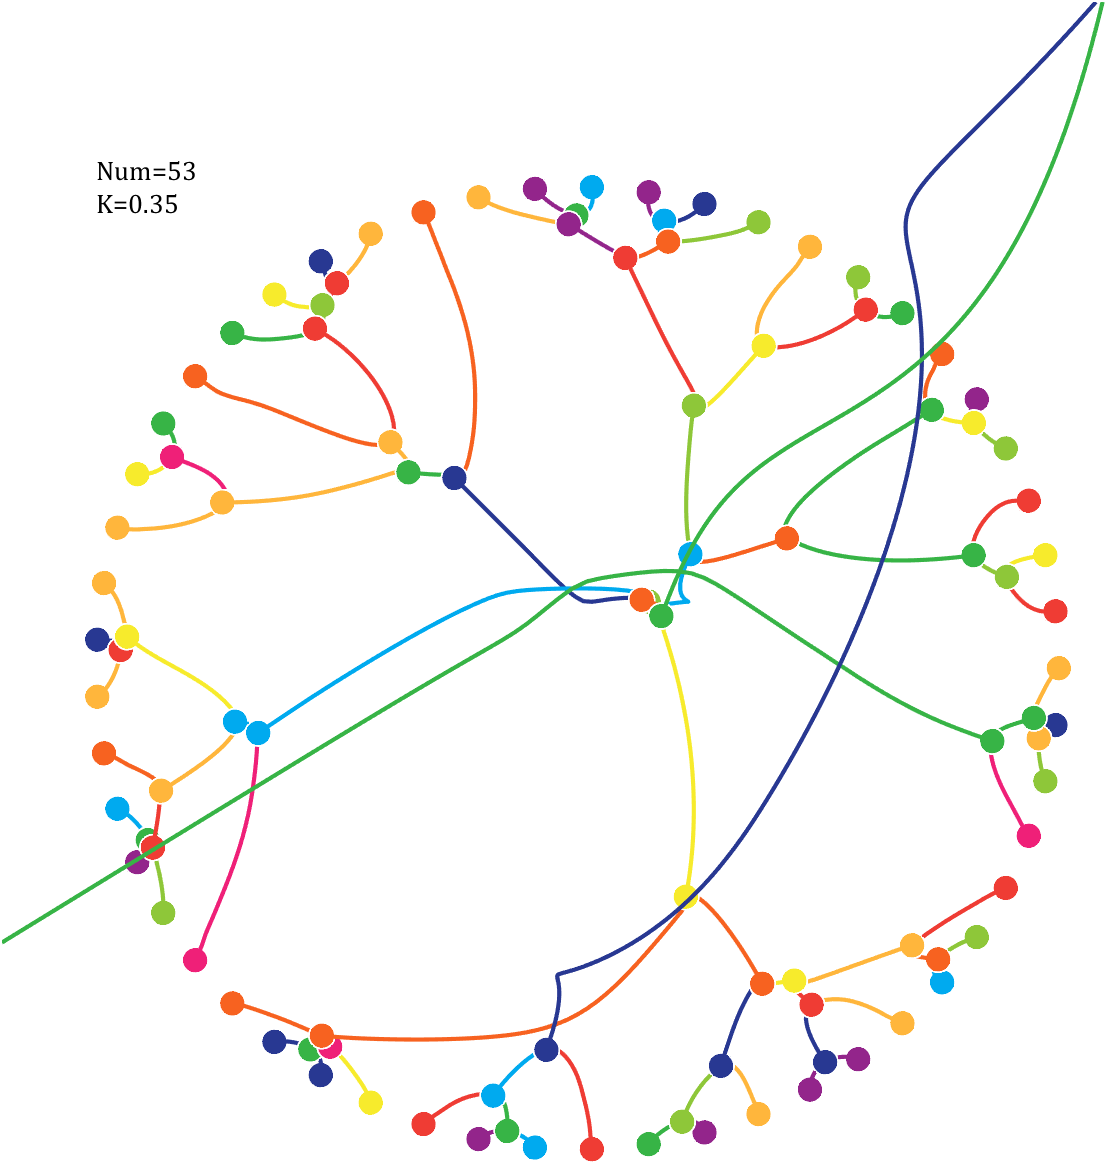
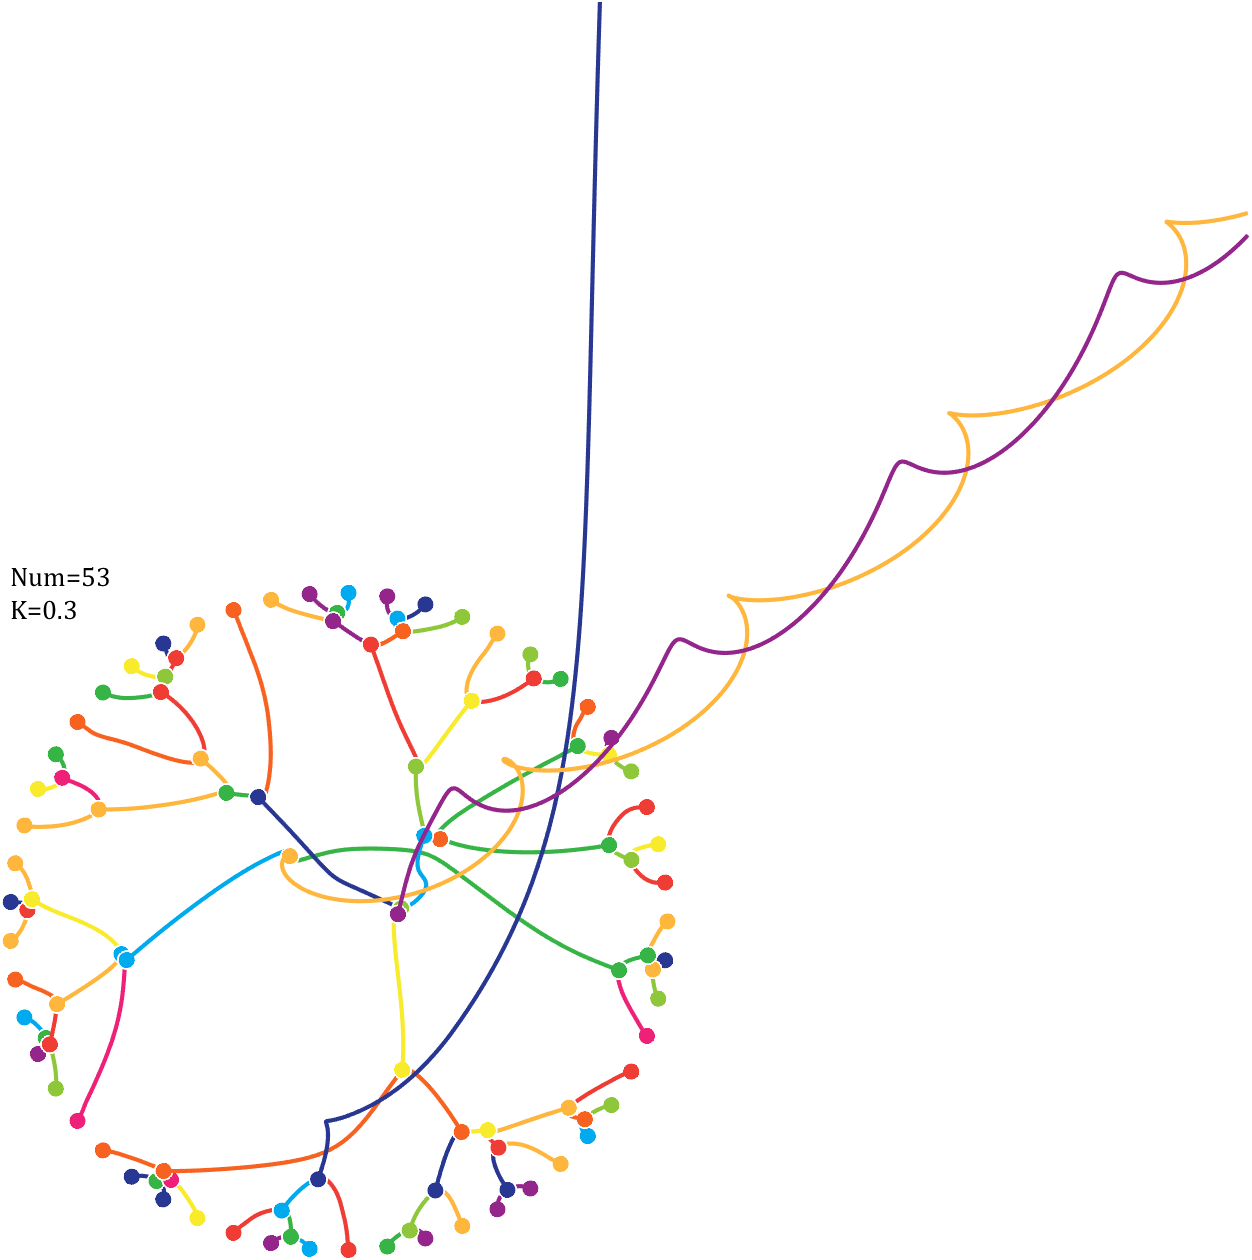
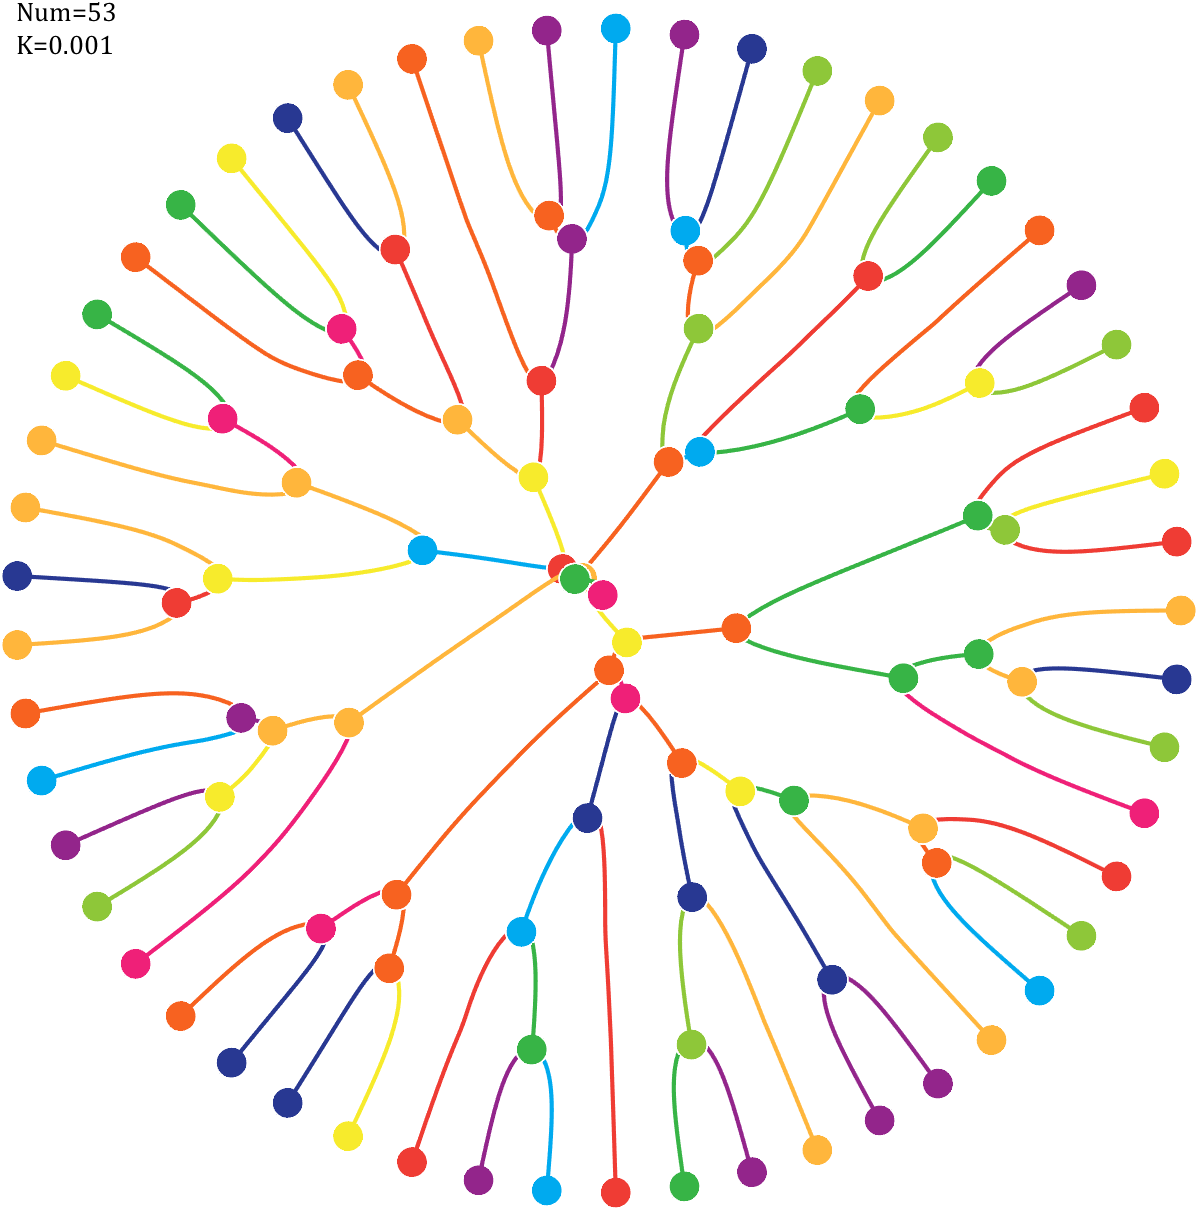
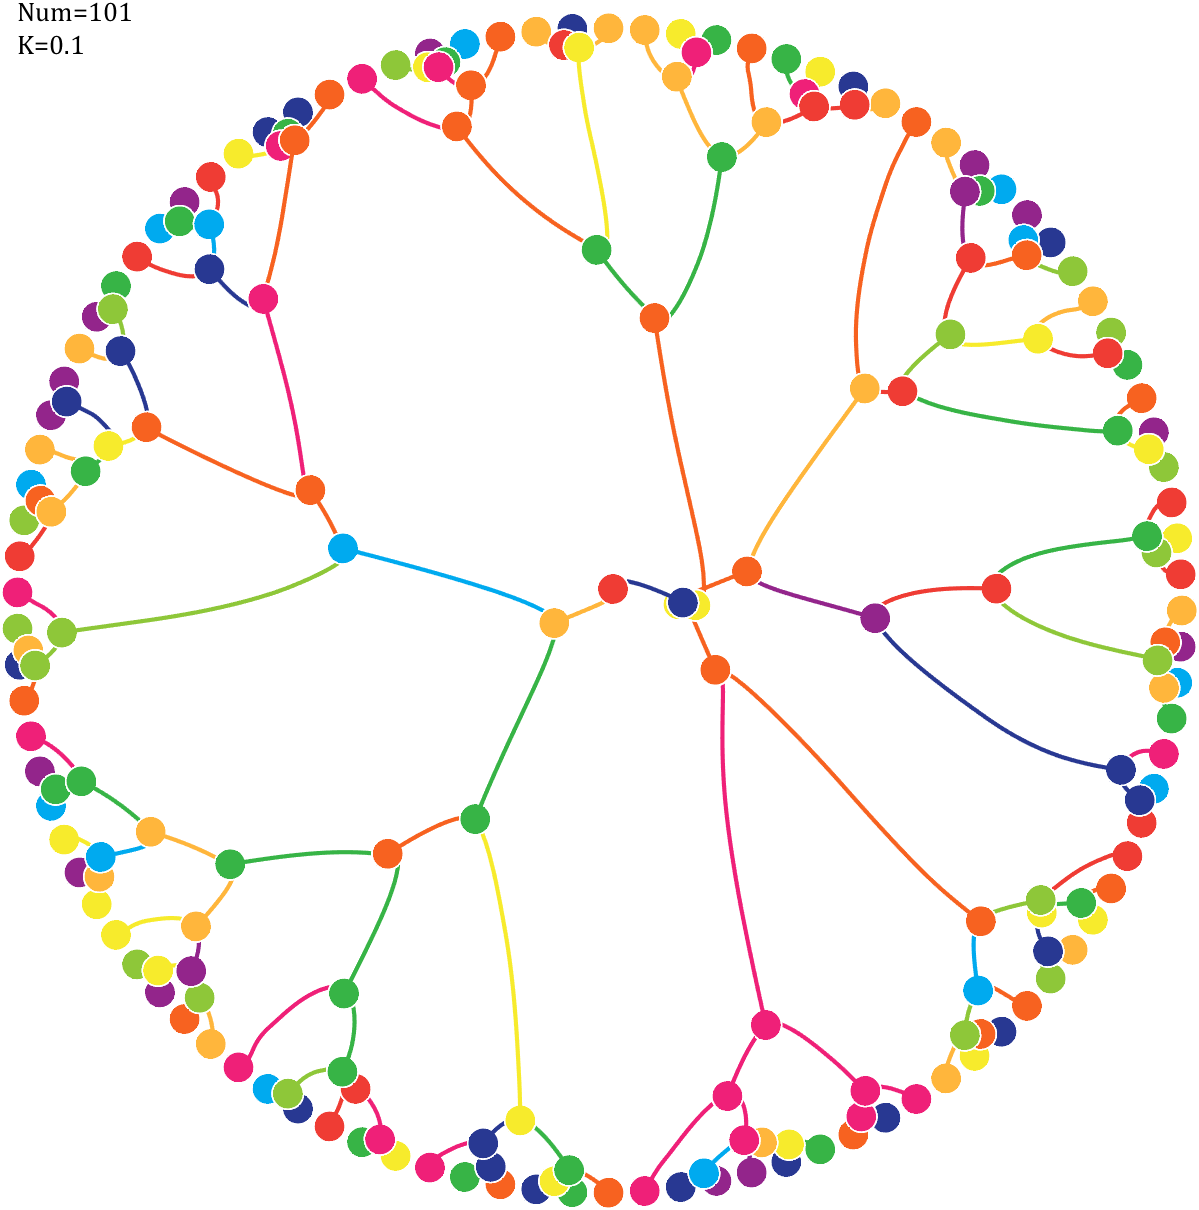
Pi=[3,getPi(71)];K=.18;
% 基础配置
CM=[239,32,120;239,60,52;247,98,32;255,182,60;247,235,44;
142,199,57;55,180,70;0,170,239;40,56,146;147,37,139]./255;
T=linspace(0,2*pi,length(Pi)+1)';
T=T(1:end-1);
ct=linspace(0,2*pi,100);
cx=cos(ct).*.027;
cy=sin(ct).*.027;
% 初始数据
Pi=Pi(:);
N=Pi;
X=cos(T);Y=sin(T);
VX=T.*0;VY=T.*0;
PX=X;PY=Y;
% 未碰撞时初始质量
getM=@(x)(x+1).^K;
M=getM(N);
% 绘制初始圆圈
hold on
for i=1:length(N)
fill(cx+X(i),cy+Y(i),CM(N(i)+1,:),'EdgeColor','w','LineWidth',1)
end
for k=1:800
% 计算加速度
Rn2=1./squareform(pdist([X,Y])).^2;
Rn2(eye(length(X))==1)=0;
MRn2=Rn2.*(M');
AX=X'-X;AY=Y'-Y;
normXY=sqrt(AX.^2+AY.^2);
AX=AX./normXY;AX(eye(length(X))==1)=0;
AY=AY./normXY;AY(eye(length(X))==1)=0;
AX=sum(AX.*MRn2,2)./150000;
AY=sum(AY.*MRn2,2)./150000;
% 计算速度及新位置
VX=VX+AX;X=X+VX;PX=[PX,X];
VY=VY+AY;Y=Y+VY;PY=[PY,Y];
% 检测是否有碰撞
R=squareform(pdist([X,Y]));
R(triu(ones(length(X)))==1)=inf;
[row,col]=find(R<=0.04);
if length(X)==1
break;
end
if ~isempty(row)
% 碰撞的点合为一体
XC=(X(row)+X(col))./2;YC=(Y(row)+Y(col))./2;
VXC=(VX(row).*M(row)+VX(col).*M(col))./(M(row)+M(col));
VYC=(VY(row).*M(row)+VY(col).*M(col))./(M(row)+M(col));
PC=nan(length(row),size(PX,2));
NC=mod(N(row)+N(col),10);
% 删除碰撞点并绘图
uniNum=unique([row;col]);
X(uniNum)=[];VX(uniNum)=[];
Y(uniNum)=[];VY(uniNum)=[];
for i=1:length(uniNum)
plot(PX(uniNum(i),:),PY(uniNum(i),:),'LineWidth',2,'Color',CM(N(uniNum(i))+1,:))
end
PX(uniNum,:)=[];PY(uniNum,:)=[];N(uniNum,:)=[];
% 绘制圆形
for i=1:length(XC)
fill(cx+XC(i),cy+YC(i),CM(NC(i)+1,:),'EdgeColor','w','LineWidth',1)
end
% 补充合体点
X=[X;XC];Y=[Y;YC];VX=[VX;VXC];VY=[VY;VYC];
PX=[PX;PC];PY=[PY;PC];N=[N;NC];M=getM(N);
end
end
for i=1:size(PX,1)
plot(PX(i,:),PY(i,:),'LineWidth',2,'Color',CM(N(i)+1,:))
end
text(-1,1,{['Num=',num2str(length(Pi))];['K=',num2str(K)]},'FontSize',13,'FontName','Cambria')
% 图窗及坐标区域修饰
set(gcf,'Position',[200,100,820,820]);
ax=gca;
ax.Position=[0,0,1,1];
ax.DataAspectRatio=[1,1,1];
ax.XLim=[-1.1,1.1];
ax.YLim=[-1.1,1.1];
ax.XTick=[];
ax.YTick=[];
ax.XColor='none';
ax.YColor='none';
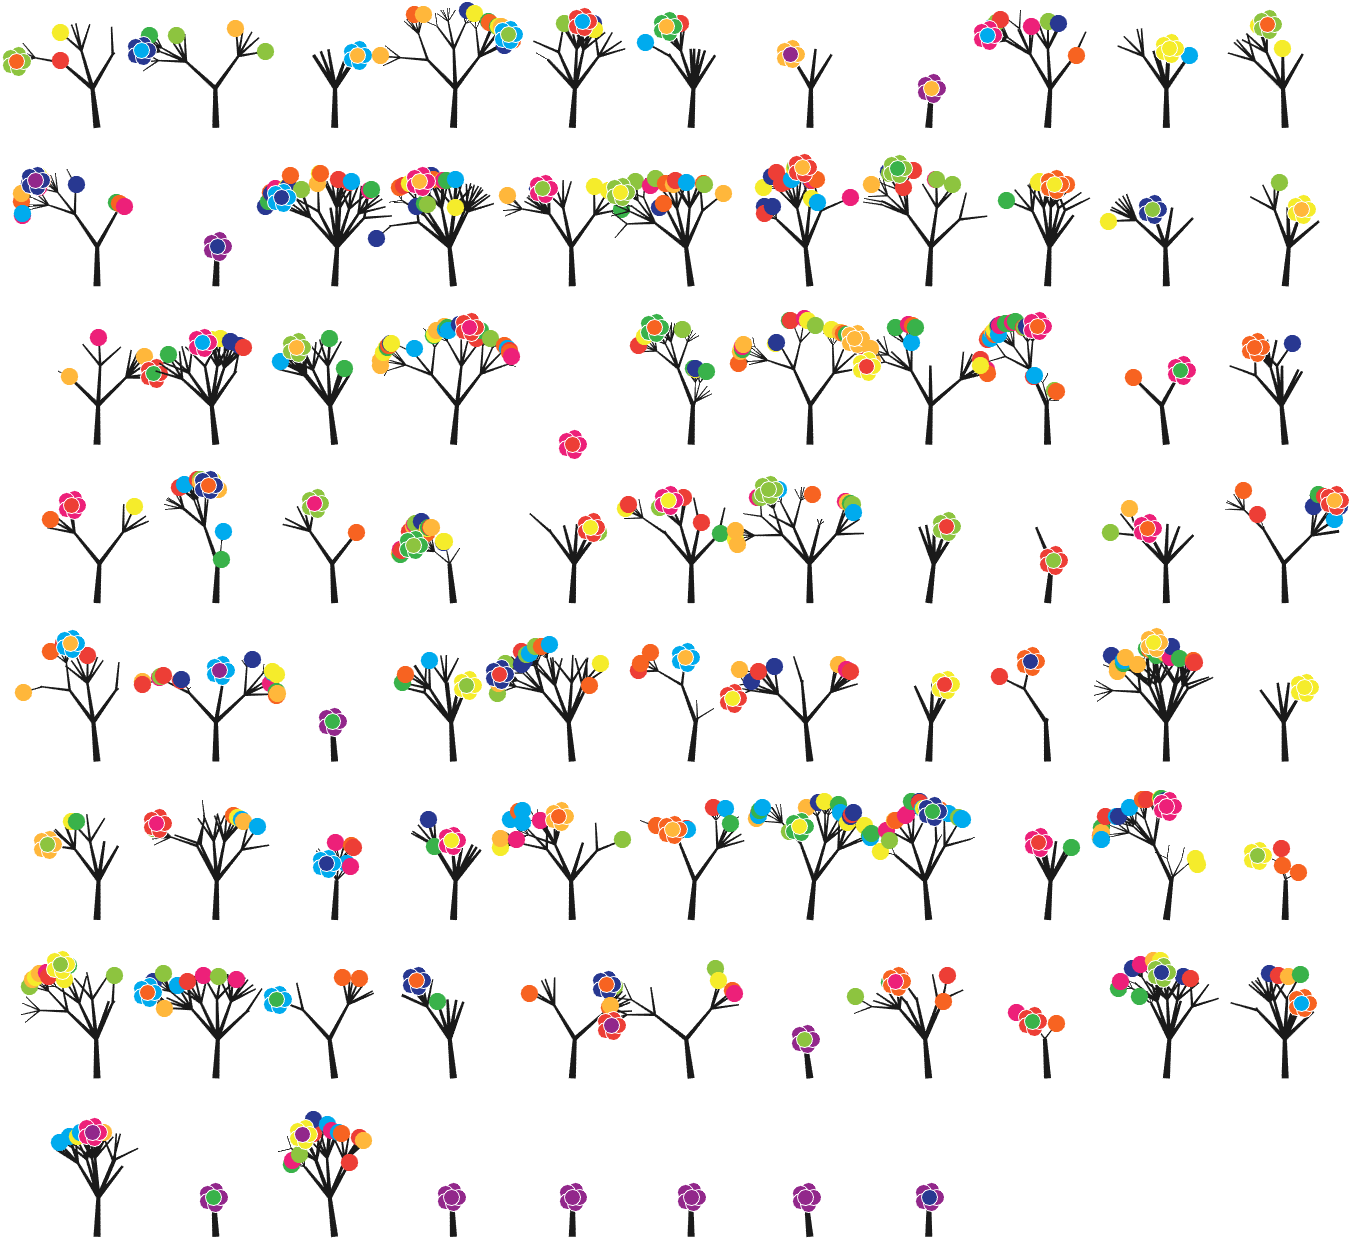
7 forest chart

The method comes from
The digits of π are shown as a forest. Each tree in the forest represents the digits of π up to the next 9. The first 10 trees are "grown" from the digit sets 314159, 2653589, 79, 3238462643383279, 50288419, 7169, 39, 9, 3751058209, and 749.
BRANCHES
The first digit of a tree controls how many branches grow from the trunk of the tree. For example, the first tree's first digit is 3, so you see 3 branches growing from the trunk.
The next digit's branches grow from the end of a branch of the previous digit in left-to-right order. This process continues until all the tree's digits have been used up.
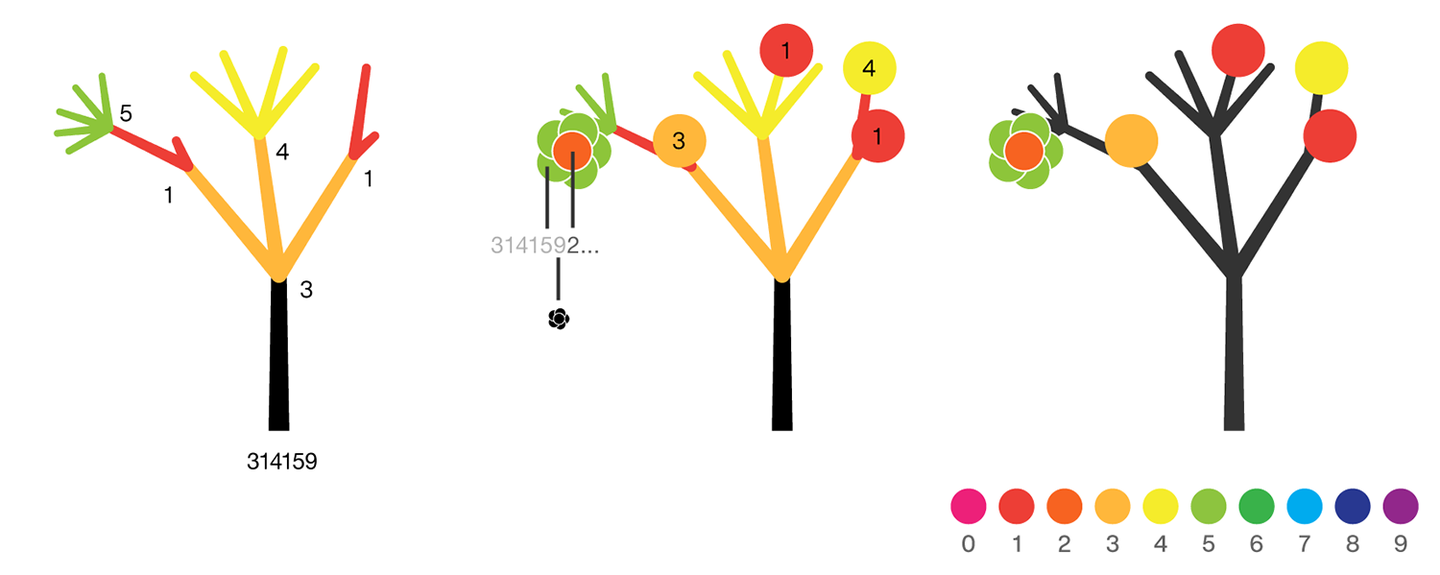
Each tree grows from a set of consecutive digits sampled from the digits of π up to the next 9. The first tree, shown here, grows from 314159. Each of the digits determine how many branches grow at each fork in the tree — the branches here are colored by their corresponding digit to illustrate this. Leaves encode the digits in a left-to-right order. The digit 9 spawns a flower on one of the branches of the previous digit. The branching exception is 0, which terminates the current branch — 0 branches grow!
LEAVES AND FLOWERS
The tree's digits themselves are drawn as circular leaves, color-coded by the digit.
The leaf exception is 9, which causes one of the branches of the previous digit to sprout a flower! The petals of the flower are colored by the digit before the 9 and the center is colored by the digit after the 9, which is on the next tree. This is how the forest propagates.
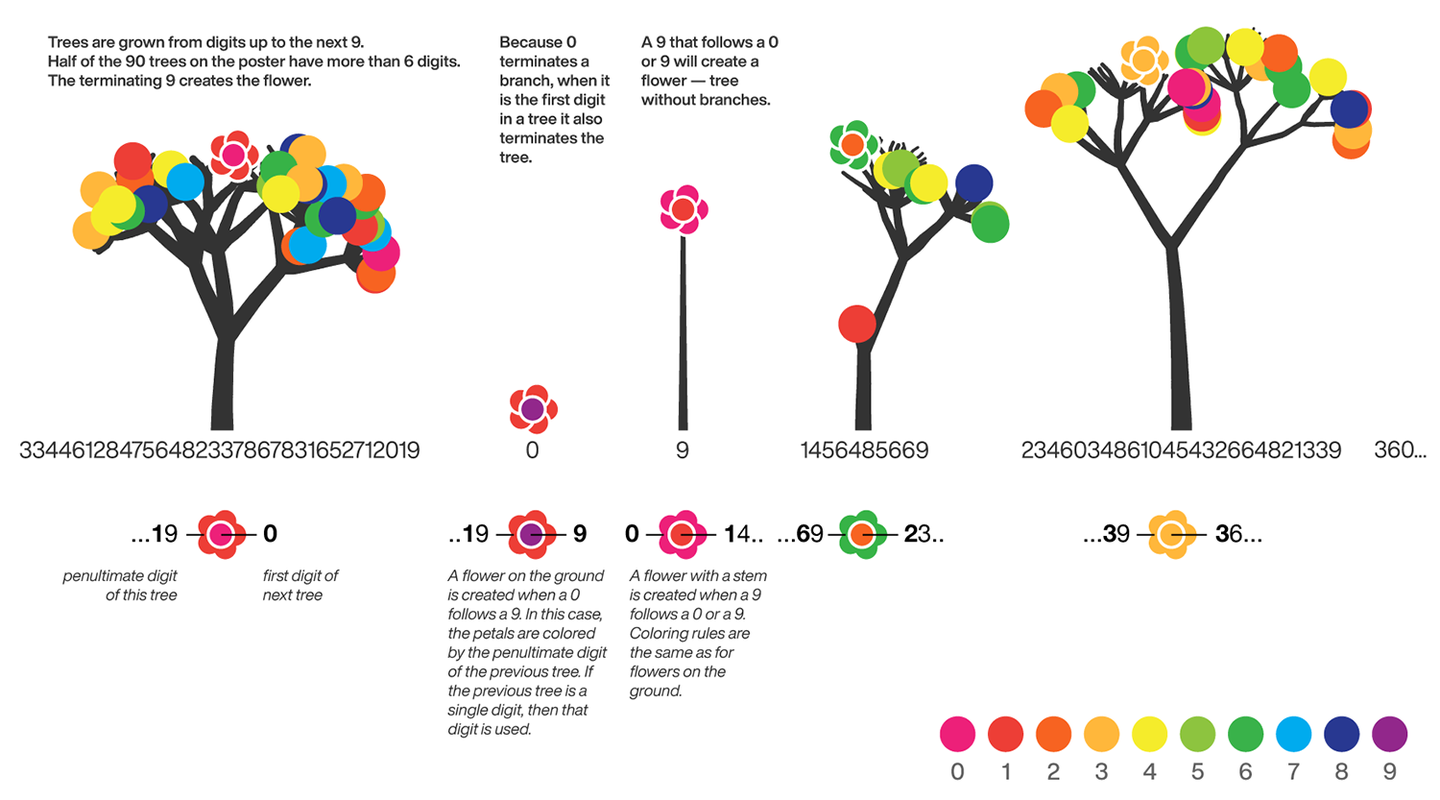
The colors of a flower are determined by the first digit of the next tree and the penultimate digit of the current tree. If the current tree only has one digit, then that digit is used. Leaves are placed at the tips of branches in a left-to-right order — you can "easily" read them off. Additionally, the leaves are distributed within the tree (without disturbing their left-to-right order) to spread them out as much as possible and avoid overlap. This order is deterministic.
The leaf placement exception are the branch set that sprouted the flower. These are not used to grow leaves — the flower needs space!
function PiTree(X,pos,D)
lw=2;
theta=pi/2+(rand(1)-.5).*pi./12;
% 树叶及花朵颜色
CM=[237,32,121;237,62,54;247,99,33;255,183,59;245,236,43;
141,196,63;57,178,74;0,171,238;40,56,145;146,39,139]./255;
hold on
if all(X(1:end-2)==0)
endSet=[pos,pos,theta];
else
kplot(pos(1)+[0,cos(theta)],pos(2)+[0,sin(theta)],lw./.6)
endSet=[pos,pos+[cos(theta),sin(theta)],theta];
% 计算层级
Layer=0;
for i=1:length(X)
Layer=[Layer,ones(1,X(i)).*i];
end
% 计算树枝
if D
for i=1:length(X)-2
if X(i)==0 % 若数值为0则不长树枝
newSet=endSet(1,:);
elseif X(i)==1 % 若数值为1则一长一短两个树枝
tTheta=endSet(1,5);
tTheta=linspace(tTheta+pi/8,tTheta-pi/8,2)'+(rand([2,1])-.5).*pi./8;
newSet=repmat(endSet(1,3:4),[X(i),1]);
newSet=[newSet.*[1;1],newSet+[cos(tTheta),sin(tTheta)].*.7^Layer(i).*[1;.1],tTheta];
else % 其他情况数值为几长几个树枝
tTheta=endSet(1,5);
tTheta=linspace(tTheta+pi/5,tTheta-pi/5,X(i))'+(rand([X(i),1])-.5).*pi./8;
newSet=repmat(endSet(1,3:4),[X(i),1]);
newSet=[newSet,newSet+[cos(tTheta),sin(tTheta)].*.7^Layer(i),tTheta];
end
% 绘制树枝
for j=1:size(newSet,1)
kplot(newSet(j,[1,3]),newSet(j,[2,4]),lw.*.6^Layer(i))
end
endSet=[endSet;newSet];
endSet(1,:)=[];
end
end
end
% 计算叶子和花朵位置
FLSet=endSet(:,3:4);
[~,FLInd]=sort(FLSet(:,1));
FLSet=FLSet(FLInd,:);
[~,tempInd]=sort(rand([1,size(FLSet,1)]));
tempInd=sort(tempInd(1:length(X)-2));
flowerInd=tempInd(randi([1,length(X)-2],[1,1]));
leafInd=tempInd(tempInd~=flowerInd);
% 绘制树叶
for i=1:length(leafInd)
scatter(FLSet(leafInd(i),1),FLSet(leafInd(i),2),70,'filled','CData',CM(X(i)+1,:))
end
% 绘制花朵
for i=1:5
% if ~D
% tC=CM(X(end)+1,:);
% else
% tC=CM(X(end-2)+1,:);
% end
scatter(FLSet(flowerInd,1)+cos(pi*2*i/5).*.18,FLSet(flowerInd,2)+sin(pi*2*i/5).*.18,60,...
'filled','CData',CM(X(end-2)+1,:),'MarkerEdgeColor',[1,1,1])
end
scatter(FLSet(flowerInd,1),FLSet(flowerInd,2),60,'filled','CData',CM(X(end)+1,:),'MarkerEdgeColor',[1,1,1])
drawnow;%axis tight
% =========================================================================
function kplot(XX,YY,LW,varargin)
LW=linspace(LW,LW*.6,10);%+rand(1,20).*LW./10;
XX=linspace(XX(1),XX(2),11)';
XX=[XX(1:end-1),XX(2:end)];
YY=linspace(YY(1),YY(2),11)';
YY=[YY(1:end-1),YY(2:end)];
for ii=1:10
plot(XX(ii,:),YY(ii,:),'LineWidth',LW(ii),'Color',[.1,.1,.1])
end
end
end
main part:
Pi=[3,getPi(800)];
pos9=[0,find(Pi==9)];
set(gcf,'Position',[200,50,900,900],'Color',[1,1,1]);
ax=gca;hold on
ax.Position=[0,0,1,1];
ax.DataAspectRatio=[1,1,1];
ax.XLim=[.5,36];
ax.XTick=[];
ax.YTick=[];
ax.XColor='none';
ax.YColor='none';
for j=1:8
for i=1:11
n=i+(j-1)*11;
if n<=85
tPi=Pi((pos9(n)+1):pos9(n+1)+1);
if length(tPi)>2
PiTree(tPi,[0+i*3,0-j*4],true);
else
PiTree([Pi(pos9(n)),tPi],[0+i*3,0-j*4],false);
end
end
end
end
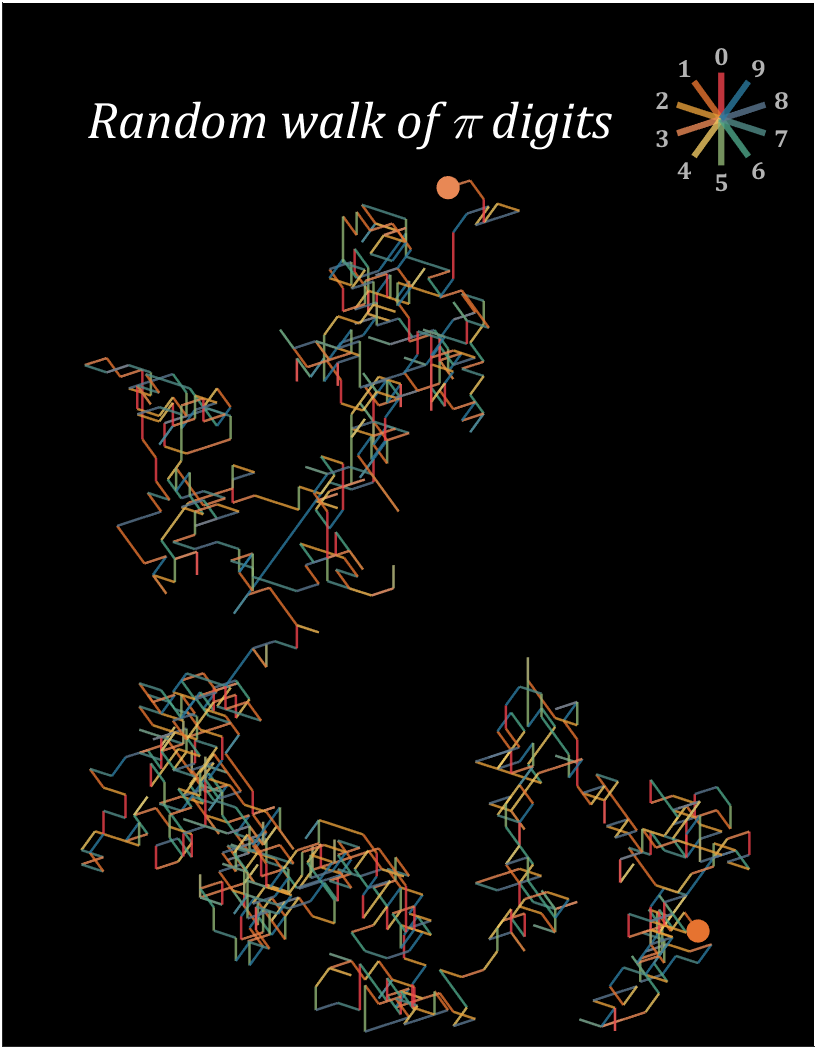
8 random walk
n=1200;
% 获取pi前n位小数
Pi=getPi(n);
CM=[239,65,75;230,115,48;229,158,57;232,136,85;239,199,97;
144,180,116;78,166,136;81,140,136;90,118,142;43,121,159]./255;
hold on
endPoint=[0,0];
t=linspace(0,2*pi,100);
T=linspace(0,2*pi,11)+pi/2;
fill(endPoint(1)+cos(t).*.5,endPoint(2)+sin(t).*.5,CM(Pi(1)+1,:),'EdgeColor','none')
for i=1:n
theta=T(Pi(i)+1);
plot(endPoint(1)+[0,cos(theta)],endPoint(2)+[0,sin(theta)],'Color',[CM(Pi(i)+1,:),.8],'LineWidth',1.2);
endPoint=endPoint+[cos(theta),sin(theta)];
end
fill(endPoint(1)+cos(t).*.5,endPoint(2)+sin(t).*.5,CM(Pi(n)+1,:),'EdgeColor','none')
% 图窗和坐标区域修饰
set(gcf,'Position',[200,100,820,820]);
ax=gca;
ax.XTick=[];
ax.YTick=[];
ax.Color=[0,0,0];
ax.DataAspectRatio=[1,1,1];
ax.XLim=[-30,5];
ax.YLim=[-5,40];
% 绘制图例
endPoint=[1,35];
for i=1:10
theta=T(i);
plot(endPoint(1)+[0,cos(theta).*2],endPoint(2)+[0,sin(theta).*2],'Color',[CM(i,:),.8],'LineWidth',3);
text(endPoint(1)+cos(theta).*2.7,endPoint(2)+sin(theta).*2.7,num2str(i-1),'Color',[1,1,1].*.7,...
'FontSize',12,'FontWeight','bold','FontName','Cambria','HorizontalAlignment','center')
end
text(-15,35,'Random walk of \pi digits','Color',[1,1,1],'FontName','Cambria',...
'HorizontalAlignment','center','FontSize',25,'FontAngle','italic')
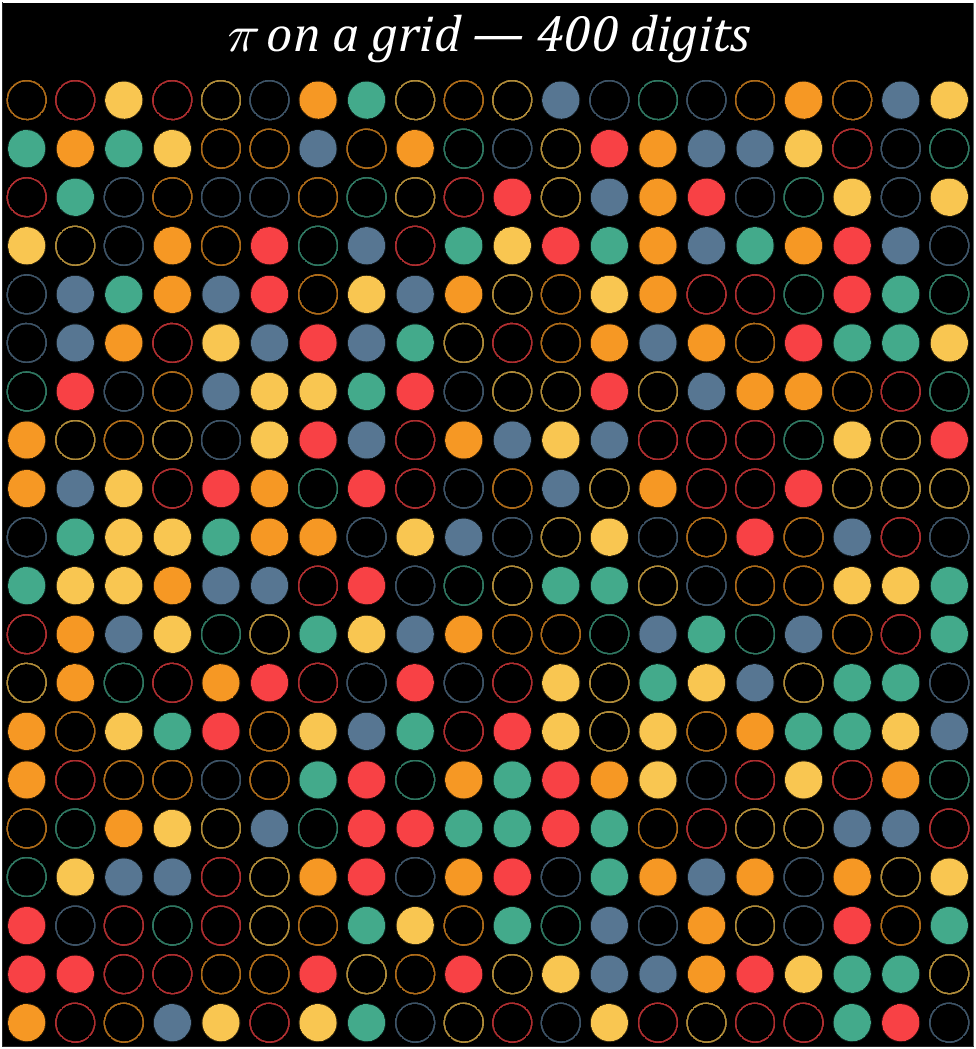
9 grid chart
Pi=[3,getPi(399)];
% 配色数据
CM=[248,65,69;246,152,36;249,198,81;67,170,139;87,118,146]./255;
% 绘制圆圈
hold on
t=linspace(0,2*pi,100);
x=cos(t).*.8.*.5;
y=sin(t).*.8.*.5;
for i=1:400
[col,row]=ind2sub([20,20],i);
if mod(Pi(i),2)==0
fill(x+col,y+row,CM(round((Pi(i)+1)/2),:),'LineWidth',1,'EdgeAlpha',.8)
else
fill(x+col,y+row,[0,0,0],'EdgeColor',CM(round((Pi(i)+1)/2),:),'LineWidth',1,'EdgeAlpha',.7)
end
end
text(10.5,-.4,'\pi on a grid — 400 digits','Color',[1,1,1],'FontName','Cambria',...
'HorizontalAlignment','center','FontSize',25,'FontAngle','italic')
% 图窗和坐标区域修饰
set(gcf,'Position',[200,100,820,820]);
ax=gca;
ax.YDir='reverse';
ax.XLim=[.5,20.5];
ax.YLim=[-1,20.5];
ax.XTick=[];
ax.YTick=[];
ax.Color=[0,0,0];
ax.DataAspectRatio=[1,1,1];
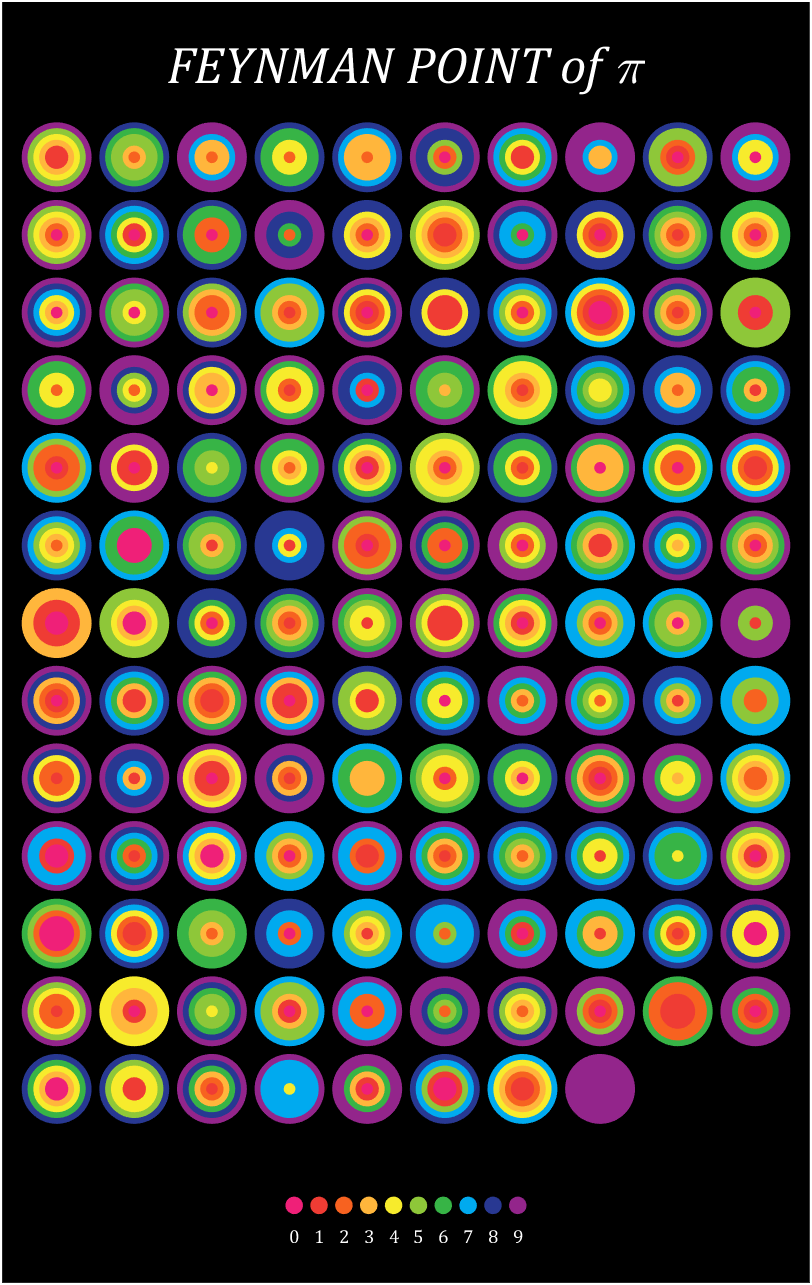
10 scale grid diagram
Let's still put the numbers in the form of circles, but the difference is that six numbers are grouped together, and the pure purple circle at the end is the six 9s that we are familiar with decimal places 762-767
Pi=[3,getPi(767)];
% 762-767
% 配色数据
CM=[239,32,120;239,60,52;247,98,32;255,182,60;247,235,44;
142,199,57;55,180,70;0,170,239;40,56,146;147,37,139]./255;
% 绘制圆圈
hold on
t=linspace(0,2*pi,100);
x=cos(t).*.9.*.5;
y=sin(t).*.9.*.5;
for i=1:6:length(Pi)
n=round((i-1)/6+1);
[col,row]=ind2sub([10,13],n);
tNum=Pi(i:i+5);
numNum=find([diff(sort(tNum)),1]);
numNum=[numNum(1),diff(numNum)];
cumNum=cumsum(numNum);
uniNum=unique(tNum);
for j=length(cumNum):-1:1
fill(x./6.*cumNum(j)+col,y./6.*cumNum(j)+row,CM(uniNum(j)+1,:),'EdgeColor','none')
end
end
% 绘制图例
for i=1:10
fill(x./4+5.5+(i-5.5)*.32,y./4+14.5,CM(i,:),'EdgeColor','none')
text(5.5+(i-5.5)*.32,14.9,num2str(i-1),'Color',[1,1,1],'FontSize',...
9,'FontName','Cambria','HorizontalAlignment','center')
end
text(5.5,-.2,'FEYNMAN POINT of \pi','Color',[1,1,1],'FontName','Cambria',...
'HorizontalAlignment','center','FontSize',25,'FontAngle','italic')
% 图窗和坐标区域修饰
set(gcf,'Position',[200,100,600,820]);
ax=gca;
ax.YDir='reverse';
ax.Position=[0,0,1,1];
ax.XLim=[.3,10.7];
ax.YLim=[-1,15.5];
ax.XTick=[];
ax.YTick=[];
ax.Color=[0,0,0];
ax.DataAspectRatio=[1,1,1];
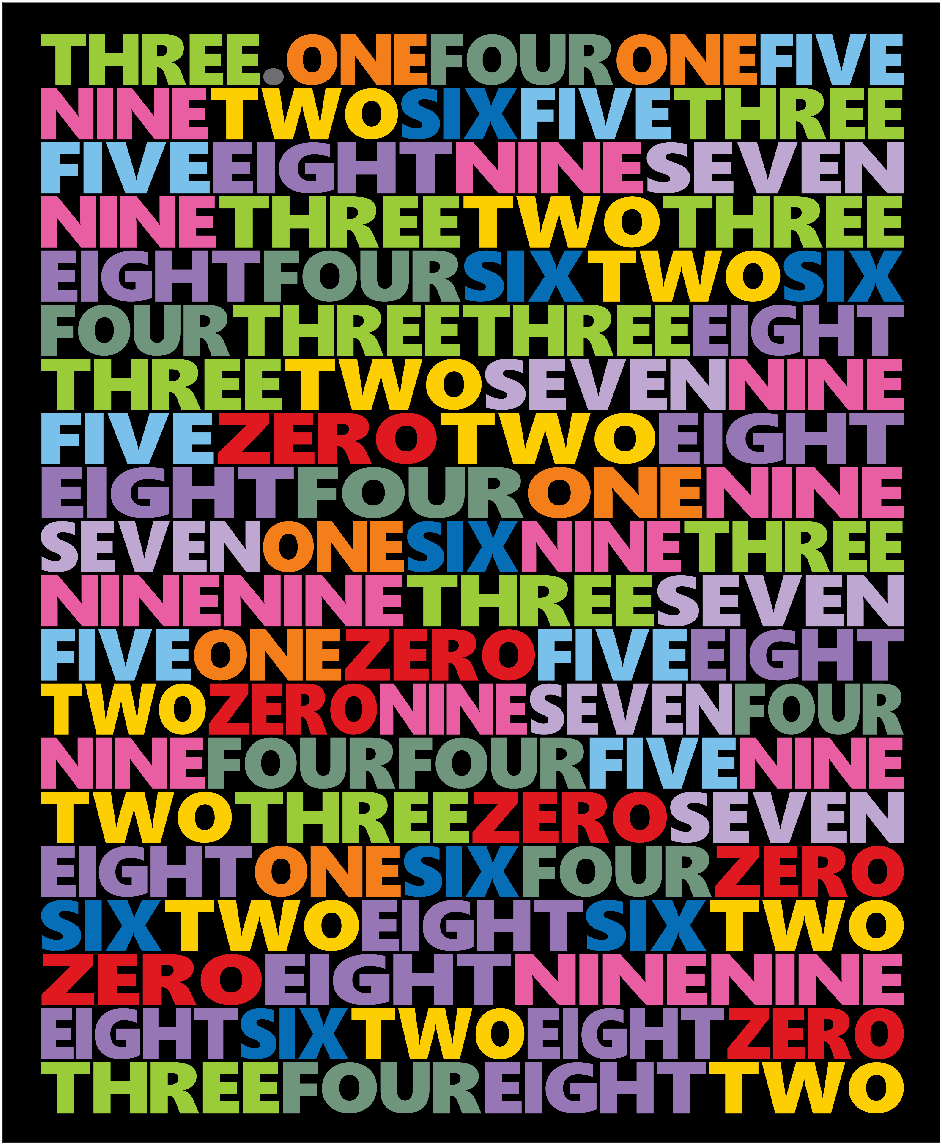
11 text chart

First, write a code to generate an image of each letter:
function getLogo
if ~exist('image','dir')
mkdir('image\')
end
logoSet=['.',char(65:90)];
for i=1:27
figure();
ax=gca;
ax.XLim=[-1,1];
ax.YLim=[-1,1];
ax.XColor='none';
ax.YColor='none';
ax.DataAspectRatio=[1,1,1];
logo=logoSet(i);
hold on
text(0,0,logo,'HorizontalAlignment','center','FontSize',320,'FontName','Segoe UI Black')
exportgraphics(ax,['image\',logo,'.png'])
close
end
dotPic=imread('image\..png');
newDotPic=uint8(ones([400,size(dotPic,2),3]).*255);
newDotPic(end-size(dotPic,1)+1:end,:,1)=dotPic(:,:,1);
newDotPic(end-size(dotPic,1)+1:end,:,2)=dotPic(:,:,2);
newDotPic(end-size(dotPic,1)+1:end,:,3)=dotPic(:,:,3);
imwrite(newDotPic,'image\..png')
S=20;
for i=1:27
logo=logoSet(i);
tPic=imread(['image\',logo,'.png']);
sz=size(tPic,[1,2]);
sz=round(sz./sz(1).*400);
tPic=imresize(tPic,sz);
tBox=uint8(255.*ones(size(tPic,[1,2])+S));
tBox(S+1:S+size(tPic,1),S+1:S+size(tPic,2))=tPic(:,:,1);
imwrite(cat(3,tBox,tBox,tBox),['image\',logo,'.png'])
end
end

Pi=[3,-1,getPi(150)];
CM=[109,110,113;224,25,33;244,126,26;253,207,2;154,203,57;111,150,124;
121,192,235;6,109,183;190,168,209;151,118,181;233,93,163]./255;
ST={'.','ZERO','ONE','TWO','THREE','FOUR','FIVE','SIX','SEVEN','EIGHT','NINE'};
n=1;
hold on
% 循环绘制字母
for i=1:20%:10
STList='';
NMList=[];
PicListR=uint8(zeros(400,0));
PicListG=uint8(zeros(400,0));
PicListB=uint8(zeros(400,0));
% PicListA=uint8(zeros(400,0));
for j=1:6
STList=[STList,ST{Pi(n)+2}];
NMList=[NMList,ones(size(ST{Pi(n)+2})).*(Pi(n)+2)];
n=n+1;
if length(STList)>15&&length(STList)+length(ST{Pi(n)+2})>20
break;
end
end
for k=1:length(STList)
tPic=imread(['image\',STList(k),'.png']);
% PicListA=[PicListA,tPic(:,:,1)];
PicListR=[PicListR,(255-tPic(:,:,1)).*CM(NMList(k),1)];
PicListG=[PicListG,(255-tPic(:,:,2)).*CM(NMList(k),2)];
PicListB=[PicListB,(255-tPic(:,:,3)).*CM(NMList(k),3)];
end
PicList=cat(3,PicListR,PicListG,PicListB);
image([-1200,1200],[0,150]-(i-1)*150,flipud(PicList))
end
% 图窗及坐标区域修饰
set(gcf,'Position',[200,100,600,820]);
ax=gca;
ax.DataAspectRatio=[1,1,1];
ax.XLim=[-1300,1300];
ax.Position=[0,0,1,1];
ax.XTick=[];
ax.YTick=[];
ax.Color=[0,0,0];
ax.YLim=[-19*150-80,230];
12 spiral chart
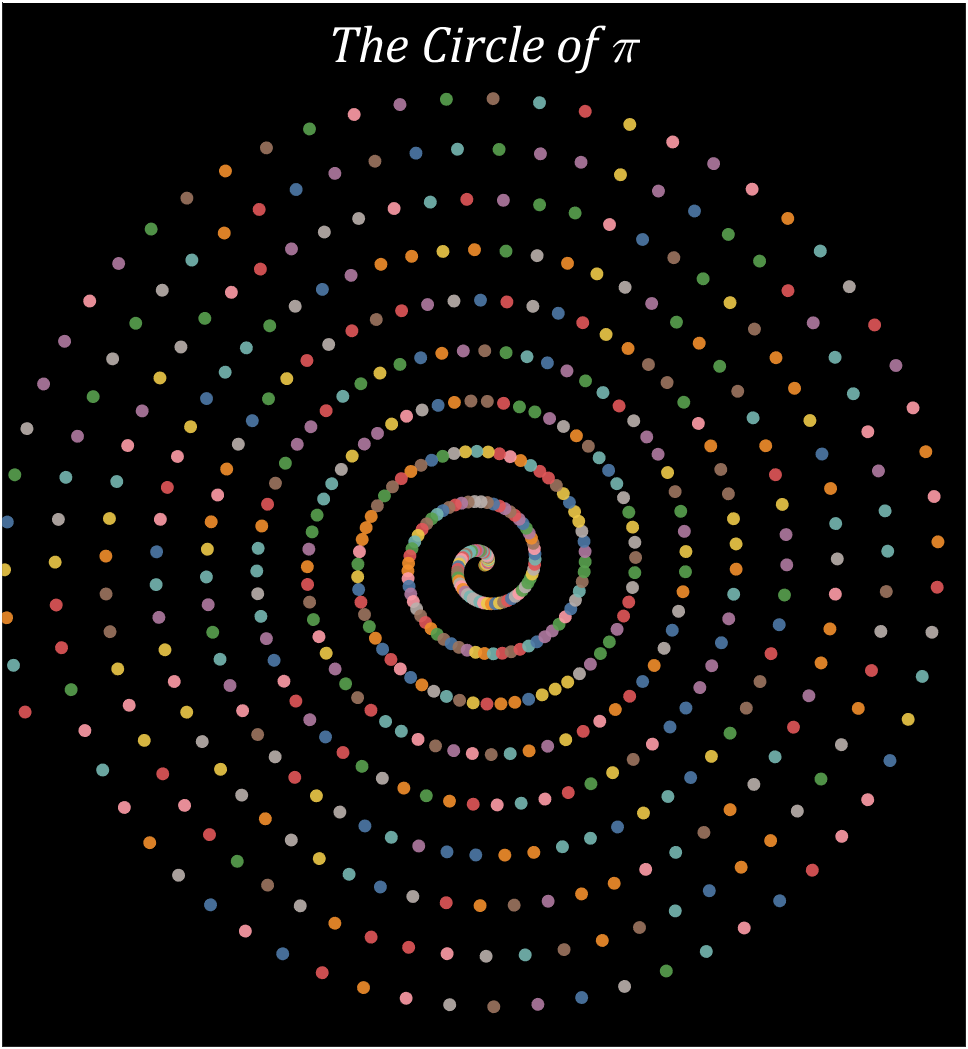
Pi=getPi(600);
% 配色列表
CM=[78,121,167;242,142,43;225,87,89;118,183,178;89,161,79;
237,201,72;176,122,161;255,157,167;156,117,95;186,176,172]./255;
% 绘制圆圈
hold on
t=linspace(0,2*pi,100);
x=cos(t).*.8;
y=sin(t).*.8;
for i=1:600
X=i.*cos(i./10)./10;
Y=i.*sin(i./10)./10;
fill(X+x,Y+y,CM(Pi(i)+1,:),'EdgeColor','none','FaceAlpha',.9)
end
text(0,65,'The Circle of \pi','Color',[1,1,1],'FontName','Cambria',...
'HorizontalAlignment','center','FontSize',25,'FontAngle','italic')
% 图窗和坐标区域修饰
set(gcf,'Position',[200,100,820,820]);
ax=gca;
ax.XLim=[-60,60];
ax.YLim=[-60,70];
ax.XTick=[];
ax.YTick=[];
ax.Color=[0,0,0];
ax.DataAspectRatio=[1,1,1];
13 Archimedean spiral diagram
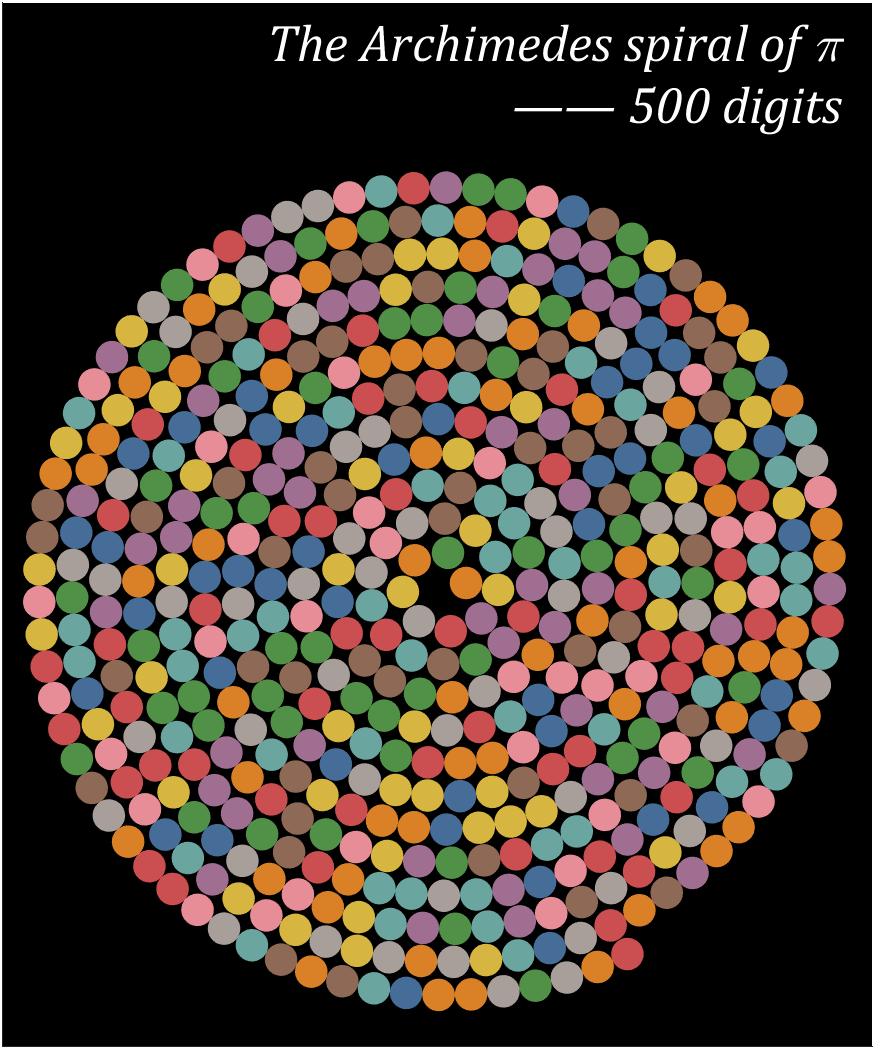
a=1;b=.227;
Pi=getPi(500);
% 配色列表
CM=[78,121,167;242,142,43;225,87,89;118,183,178;89,161,79;
237,201,72;176,122,161;255,157,167;156,117,95;186,176,172]./255;
% 绘制圆圈
hold on
T=0;R=1;
t=linspace(0,2*pi,100);
x=cos(t).*.7;
y=sin(t).*.7;
for i=1:500
X=R.*cos(T);Y=R.*sin(T);
fill(X+x,Y+y,CM(Pi(i)+1,:),'EdgeColor','none','FaceAlpha',.9)
T=T+1./R.*1.4;
R=a+b*T;
end
text(17.25,22,{'The Archimedes spiral of \pi';'—— 500 digits'},...
'Color',[1,1,1],'FontName','Cambria',...
'HorizontalAlignment','right','FontSize',25,'FontAngle','italic')
% 图窗和坐标区域修饰
set(gcf,'Position',[200,100,820,820]);
ax=gca;
ax.XLim=[-19,18.5];
ax.YLim=[-20,25];
ax.XTick=[];
ax.YTick=[];
ax.Color=[0,0,0];
ax.DataAspectRatio=[1,1,1];
14 proportional Archimedean spiral diagram
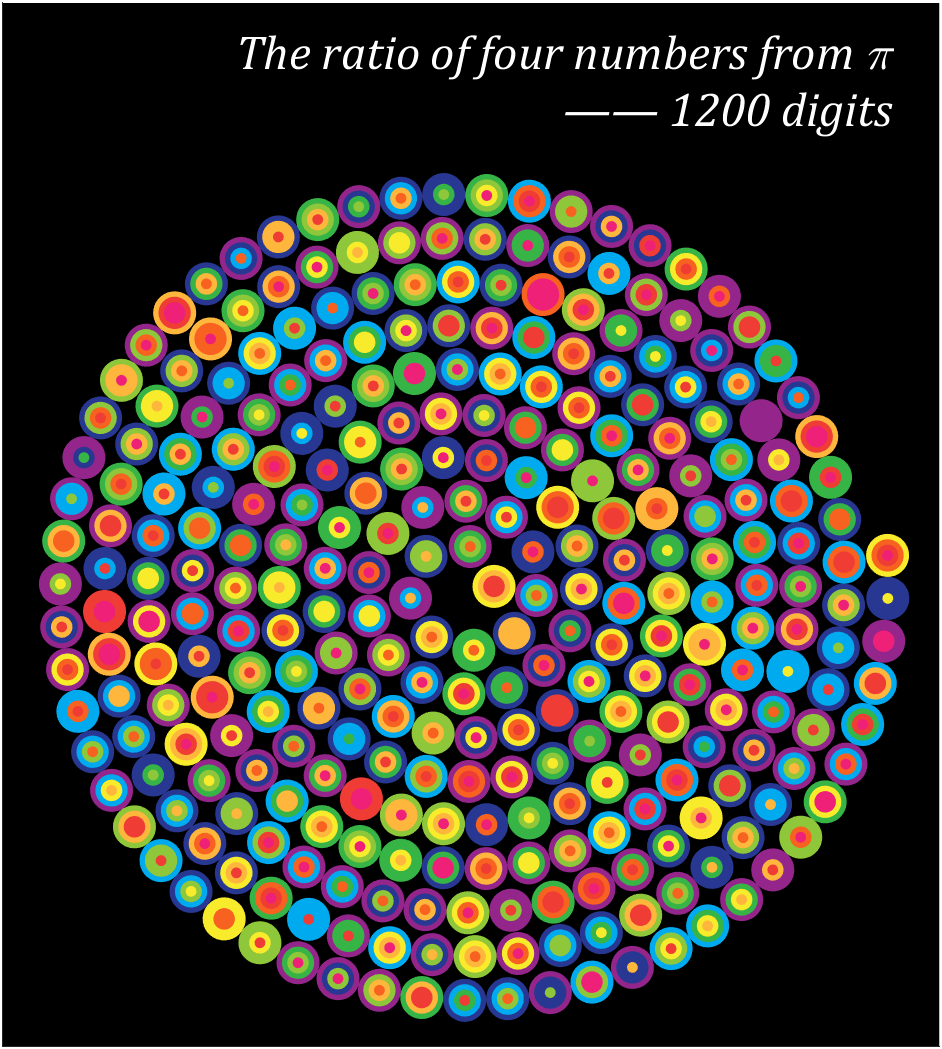
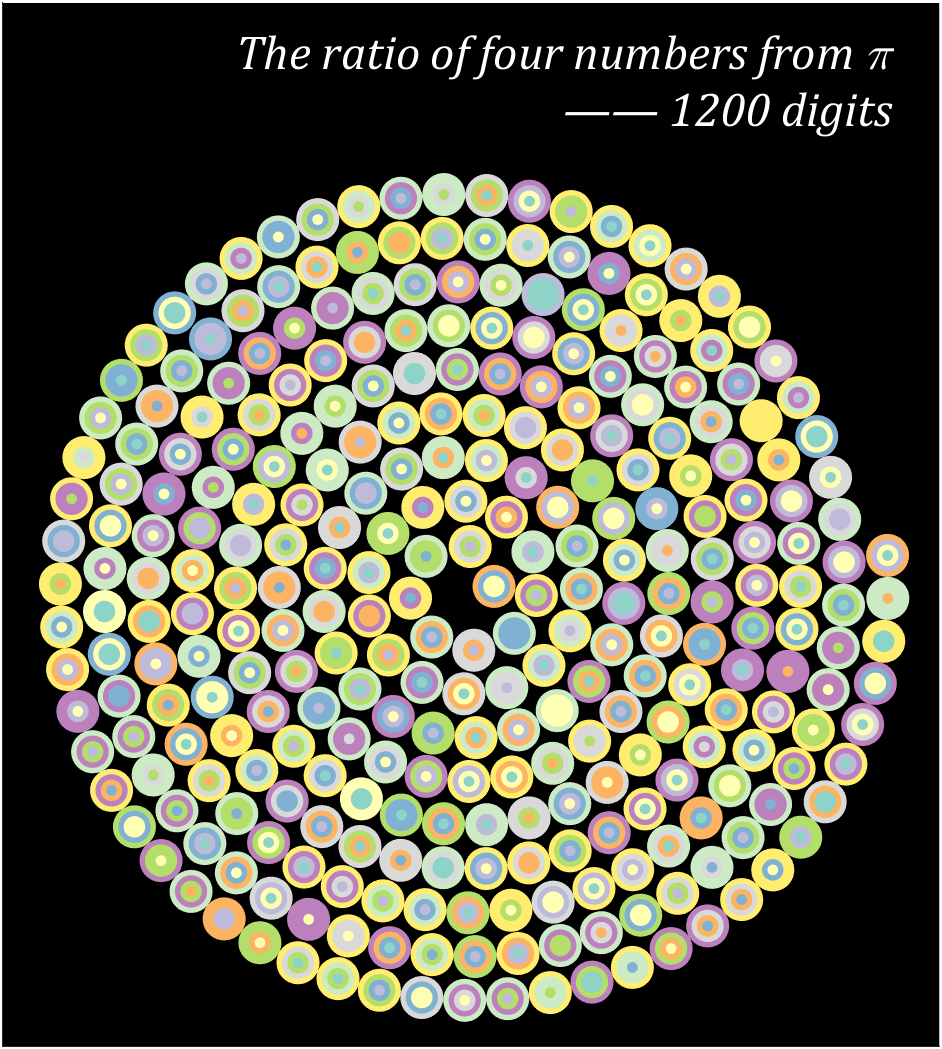
Pi=[3,getPi(1199)];
% 配色数据
CM=[239,32,120;239,60,52;247,98,32;255,182,60;247,235,44;
142,199,57;55,180,70;0,170,239;40,56,146;147,37,139]./255;
% CM=slanCM(184,10);
% 绘制圆圈
hold on
T=0;R=1;
t=linspace(0,2*pi,100);
x=cos(t).*.7;
y=sin(t).*.7;
for i=1:4:length(Pi)
X=R.*cos(T);Y=R.*sin(T);
tNum=Pi(i:i+3);
numNum=find([diff(sort(tNum)),1]);
numNum=[numNum(1),diff(numNum)];
cumNum=cumsum(numNum);
uniNum=unique(tNum);
for j=length(cumNum):-1:1
fill(x./4.*cumNum(j)+X,y./4.*cumNum(j)+Y,CM(uniNum(j)+1,:),'EdgeColor','none')
end
T=T+1./R.*1.4;
R=a+b*T;
end
text(14,16.5,{'The ratio of four numbers from \pi';'—— 1200 digits'},...
'Color',[1,1,1],'FontName','Cambria',...
'HorizontalAlignment','right','FontSize',23,'FontAngle','italic')
% 图窗和坐标区域修饰
set(gcf,'Position',[200,100,820,820]);
ax=gca;
ax.XLim=[-15,15.5];
ax.YLim=[-15,19];
ax.XTick=[];
ax.YTick=[];
ax.Color=[0,0,0];
ax.DataAspectRatio=[1,1,1];
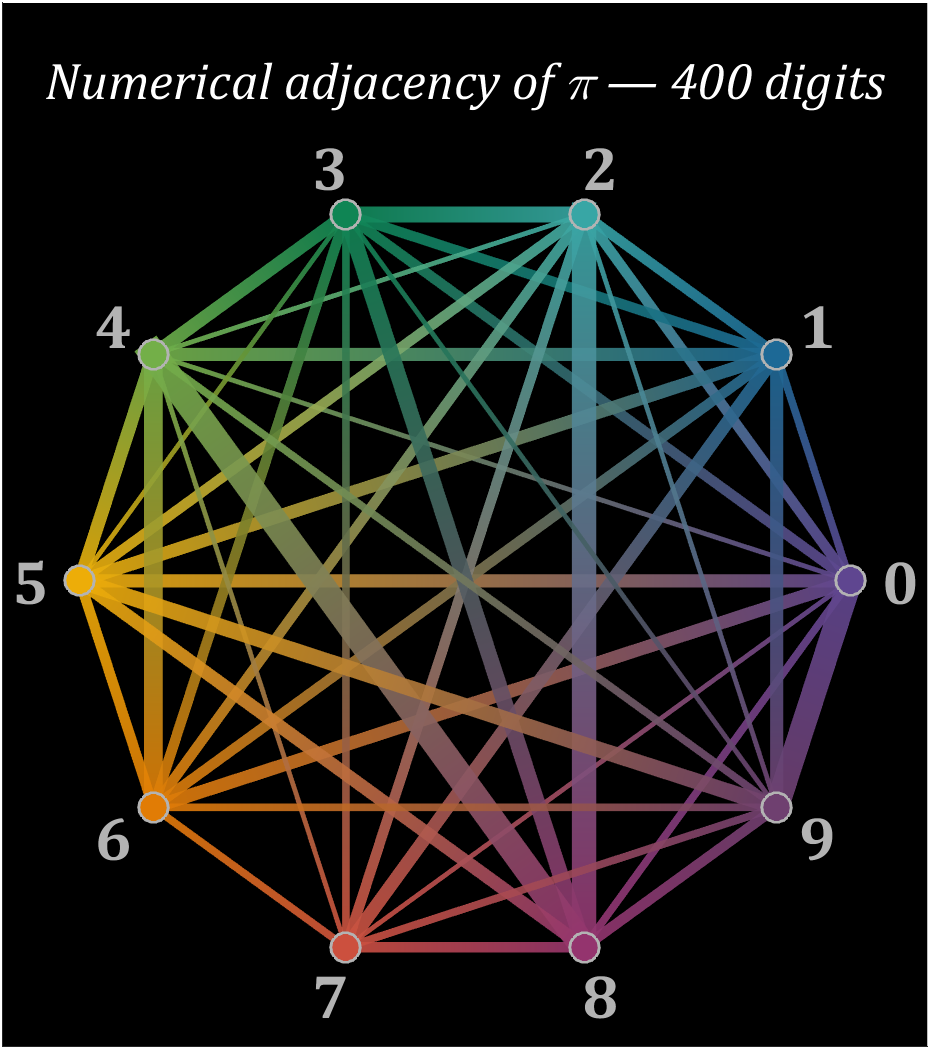
15 graph
% 构建连接矩阵
corrMat=zeros(10,10);
Pi=getPi(401);
for i=1:400
corrMat(Pi(i)+1,Pi(i+1)+1)=corrMat(Pi(i)+1,Pi(i+1)+1)+1;
end
% 配色列表
colorList=[0.3725 0.2745 0.5647
0.1137 0.4118 0.5882
0.2196 0.6510 0.6471
0.0588 0.5216 0.3294
0.4510 0.6863 0.2824
0.9294 0.6784 0.0314
0.8824 0.4863 0.0196
0.8000 0.3137 0.2431
0.5804 0.2039 0.4314
0.4353 0.2510 0.4392];
t=linspace(0,2*pi,11);t=t(1:10)';
posXY=[cos(t),sin(t)];
maxWidth=max(corrMat(corrMat>0));
minWidth=min(corrMat(corrMat>0));
ttList=linspace(0,1,3)';
% 循环绘图
hold on
for i=1:size(corrMat,1)
for j=i+1:size(corrMat,2)
if corrMat(i,j)>0
tW=(corrMat(i,j)-minWidth)./(maxWidth-minWidth);
colorData=(1-ttList).*colorList(i,:)+ttList.*colorList(j,:);
CData(:,:,1)=colorData(:,1);
CData(:,:,2)=colorData(:,2);
CData(:,:,3)=colorData(:,3);
% 绘制连线
fill(linspace(posXY(i,1),posXY(j,1),3),...
linspace(posXY(i,2),posXY(j,2),3),[0,0,0],'LineWidth',tW.*12+1,...
'CData',CData,'EdgeColor','interp','EdgeAlpha',.7,'FaceAlpha',.7)
end
end
% 绘制圆点
scatter(posXY(i,1),posXY(i,2),200,'filled','LineWidth',1.2,...
'MarkerFaceColor',colorList(i,:),'MarkerEdgeColor',[.7,.7,.7]);
text(posXY(i,1).*1.13,posXY(i,2).*1.13,num2str(i-1),'Color',[1,1,1].*.7,...
'FontSize',30,'FontWeight','bold','FontName','Cambria','HorizontalAlignment','center')
end
text(0,1.3,'Numerical adjacency of \pi — 400 digits','Color',[1,1,1],'FontName','Cambria',...
'HorizontalAlignment','center','FontSize',25,'FontAngle','italic')
% 图窗和坐标区域修饰
set(gcf,'Position',[200,100,820,820]);
ax=gca;
ax.XLim=[-1.2,1.2];
ax.YLim=[-1.21,1.5];
ax.XTick=[];
ax.YTick=[];
ax.Color=[0,0,0];
ax.DataAspectRatio=[1,1,1];
16 circos chart
Need to use this tool:
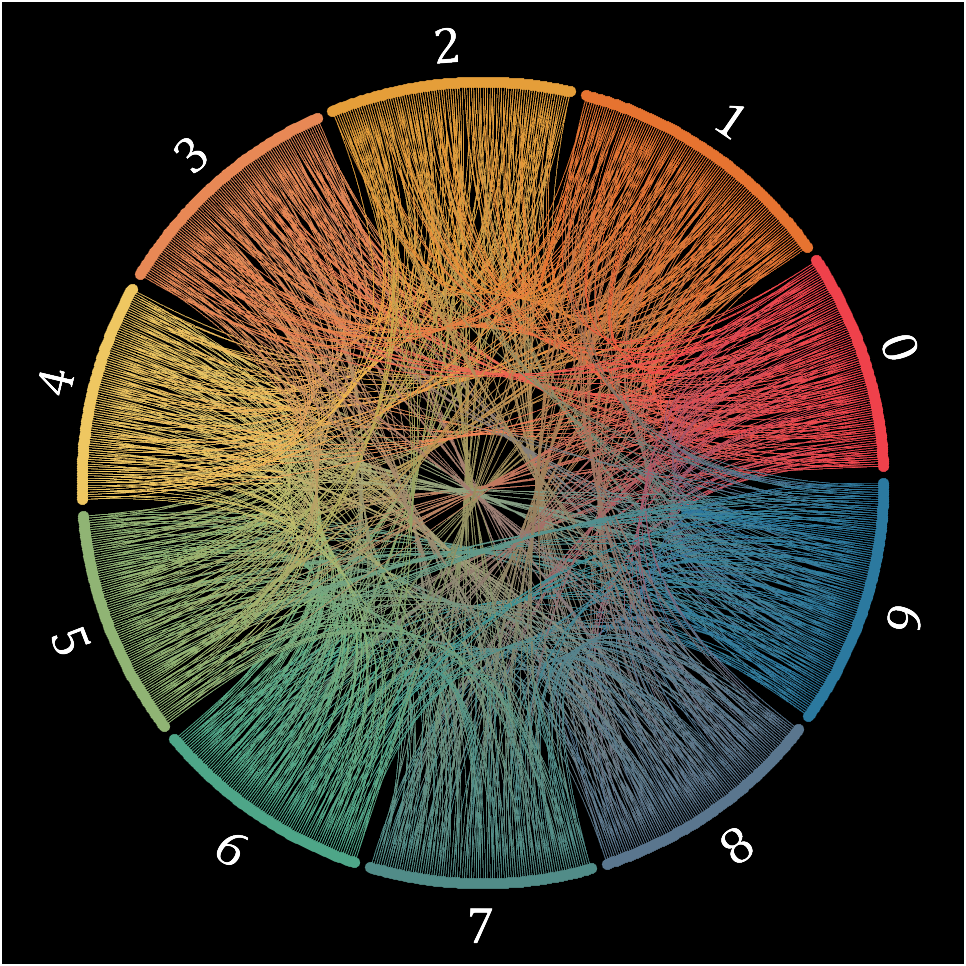
Class=getPi(1001)+1;
Data=diag(ones(1,1000),-1);
className={'0','1','2','3','4','5','6','7','8','9'};
colorOrder=[239,65,75;230,115,48;229,158,57;232,136,85;239,199,97;
144,180,116;78,166,136;81,140,136;90,118,142;43,121,159]./255;
CC=circosChart(Data,Class,'ClassName',className,'ColorOrder',colorOrder);
CC=CC.draw();
ax=gca;
ax.Color=[0,0,0];
CC.setClassLabel('Color',[1,1,1],'FontSize',25,'FontName','Cambria')
CC.setLine('LineWidth',.7)
YOU CAN GET ALL CODE HERE:
2 x 2 행렬의 행렬식은
- 행렬의 두 row 벡터로 정의되는 평행사변형의 면적입니다.
- 물론 두 column 벡터로 정의되는 평행사변형의 면적이기도 합니다.
- 좀 더 정확히는 signed area입니다. 면적이 음수가 될 수도 있다는 뜻이죠.
- 행렬의 두 행(또는 두 열)을 맞바꾸면 행렬식의 부호도 바뀌고 면적의 부호도 바뀌어야합니다.
일반적으로 n x n 행렬의 행렬식은
- 각 row 벡터(또는 각 column 벡터)로 정의되는 N차원 공간의 평행면체(?)의 signed area입니다.
- 제대로 이해하려면 대수학의 개념을 많이 가지고 와야 하는데 자세한 설명은 생략합니다.(=저도 모른다는 뜻)
- 더 자세히 알고 싶으시면 수학하는 만화의 '넓이 이야기' 편을 추천합니다.
- 수학적인 정의를 알고 싶으시면 위키피디아를 보시면 됩니다.
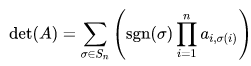
- 이렇게 생겼습니다. 좀 무섭습니다.
아래 코드는...
- 2 x 2 행렬에 대해서 이것을 수식 없이 그림만으로 증명하는 과정입니다.
- gif 생성에는 ScreenToGif를 사용했습니다. (gif 만들기엔 이게 킹왕짱인듯)
Determinant of 2 x 2 matrix is...
- An area of a parallelogram defined by two row vectors.
- Of course, same one defined by two column vectors.
- Precisely, a signed area, which means area can be negative.
- If two rows (or columns) are swapped, both the sign of determinant and area change.
More generally, determinant of n x n matrix is...
- Signed area of parallelepiped defined by rows (or columns) of the matrix in n-dim space.
- For a full understanding, a lot of concepts from abstract algebra should be brought, which I will not write here. (Cuz I don't know them.)
- For a mathematical definition of determinant, visit wikipedia.

- A little scary, isn't it?
The code below is...
- A process to prove the equality of the determinant of 2 x 2 matrix and the area of parallelogram.
- ScreenToGif is used to generate gif animation (which is, to me, the easiest way to make gif).
% 두 점 (a, b), (c, d)의 좌표
a = 4;
b = 1;
c = 1;
d = 3;
% patch 색 pre-define
lightgreen = [144, 238, 144]/255;
lightblue = [169, 190, 228]/255;
lightorange = [247, 195, 160]/255;
% animation params.
anim_Nsteps = 30;
% create window
figure('WindowStyle','docked')
ax = axes;
ax.XAxisLocation = 'origin';
ax.YAxisLocation = 'origin';
ax.XTick = [];
ax.YTick = [];
hold on
ax.XLim = [-.4, a+c+1];
ax.YLim = [-.4, b+d+1];
% create ad-bc patch
area = patch([0, a, a+c, c], [0, b, b+d, d], lightgreen);
p_ab = plot(a, b, 'ko', 'MarkerFaceColor', 'k');
p_cd = plot(c, d, 'ko', 'MarkerFaceColor', 'k');
p_ab.UserData = text(a+0.1, b, '(a, b)', 'FontSize',16);
p_cd.UserData = text(c+0.1, d-0.2, '(c, d)', 'FontSize',16);
area.UserData = text((a+c)/2-0.5, (b+d)/2, 'ad-bc', 'FontSize', 18);
pause
%% Is this really ad-bc?
area.UserData.String = 'ad-bc...?';
pause
%% fade out ad-bc
fadeinout(area, 0)
area.UserData.Visible = 'off';
pause
%% fade in ad block
rect_ad = patch([0, a, a, 0], [0, 0, d, d], lightblue, 'EdgeAlpha', 0, 'FaceAlpha', 0);
uistack(rect_ad, 'bottom');
fadeinout(rect_ad, 1, t_pause=0.003)
draw_gridline(rect_ad, ["23", "34"])
rect_ad.UserData = text(mean(rect_ad.XData), mean(rect_ad.YData), 'ad', 'FontSize', 20, 'HorizontalAlignment', 'center');
pause
%% fade-in bc block
rect_bc = patch([0, c, c, 0], [0, 0, b, b], lightorange, 'EdgeAlpha', 0, 'FaceAlpha', 0);
fadeinout(rect_bc, 1, t_pause=0.0035)
draw_gridline(rect_bc, ["23", "34"])
rect_bc.UserData = text(b/2, c/2, 'bc', 'FontSize', 20, 'HorizontalAlignment', 'center');
pause
%% slide ad block
patch_slide(rect_ad, ...
[0, 0, 0, 0], [0, b, b, 0], t_pause=0.004)
draw_gridline(rect_ad, ["12", "34"])
pause
%% slide ad block
patch_slide(rect_ad, ...
[0, 0, d/(d/c-b/a), d/(d/c-b/a)],...
[0, 0, b/a*d/(d/c-b/a), b/a*d/(d/c-b/a)], t_pause=0.004)
draw_gridline(rect_ad, ["14", "23"])
pause
%% slide bc block
uistack(p_cd, 'top')
patch_slide(rect_bc, ...
[0, 0, 0, 0], [d, d, d, d], t_pause=0.004)
draw_gridline(rect_bc, "34")
pause
%% slide bc block
patch_slide(rect_bc, ...
[0, 0, a, a], [0, 0, 0, 0], t_pause=0.004)
draw_gridline(rect_bc, "23")
pause
%% slide bc block
patch_slide(rect_bc, ...
[d/(d/c-b/a), 0, 0, d/(d/c-b/a)], ...
[b/a*d/(d/c-b/a), 0, 0, b/a*d/(d/c-b/a)], t_pause=0.004)
pause
%% finalize: fade out ad, bc, and fade in ad-bc
rect_ad.UserData.Visible = 'off';
rect_bc.UserData.Visible = 'off';
fadeinout([rect_ad, rect_bc, area], [0, 0, 1])
area.UserData.String = 'ad-bc';
area.UserData.Visible = 'on';
%% functions
function fadeinout(objs, inout, options)
arguments
objs
inout % 1이면 fade-in, 0이면 fade-out
options.anim_Nsteps = 30
options.t_pause = 0.003
end
for alpha = linspace(0, 1, options.anim_Nsteps)
for i = 1:length(objs)
switch objs(i).Type
case 'patch'
objs(i).FaceAlpha = (inout(i)==1)*alpha + (inout(i)==0)*(1-alpha);
objs(i).EdgeAlpha = (inout(i)==1)*alpha + (inout(i)==0)*(1-alpha);
case 'constantline'
objs(i).Alpha = (inout(i)==1)*alpha + (inout(i)==0)*(1-alpha);
end
pause(options.t_pause)
end
end
end
function patch_slide(obj, x_dist, y_dist, options)
arguments
obj
x_dist
y_dist
options.anim_Nsteps = 30
options.t_pause = 0.003
end
dx = x_dist/options.anim_Nsteps;
dy = y_dist/options.anim_Nsteps;
for i=1:options.anim_Nsteps
obj.XData = obj.XData + dx(:);
obj.YData = obj.YData + dy(:);
obj.UserData.Position(1) = mean(obj.XData);
obj.UserData.Position(2) = mean(obj.YData);
pause(options.t_pause)
end
end
function draw_gridline(patch, where)
ax = patch.Parent;
for i=1:length(where)
v1 = str2double(where{i}(1));
v2 = str2double(where{i}(2));
x1 = patch.XData(v1);
x2 = patch.XData(v2);
y1 = patch.YData(v1);
y2 = patch.YData(v2);
if x1==x2
xline(x1, 'k--')
else
fplot(@(x) (y2-y1)/(x2-x1)*(x-x1)+y1, [ax.XLim(1), ax.XLim(2)], 'k--')
end
end
end