Spatial Reuse with BSS Coloring in 802.11ax Network Simulation
This example shows how to simulate the impact of spatial reuse (SR) with basic service set (BSS) coloring on the throughput of an IEEE® Std 802.11ax™ (Wi-Fi® 6) [1] network.
Using this example, you can:
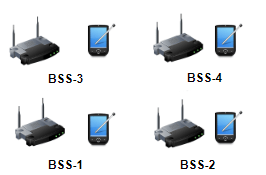
Create and configure an 802.11ax network topology consisting of four BSSs. Each BSS includes an access point (AP) and a station (STA).
Assign BSS colors to each BSS and configure the overlapping BSS packet detect (OBSS PD) threshold to simulate non-spatial reuse groups OBSS PD, as defined in IEEE Std 802.11ax-2021 [1].
Simulate the network with and without BSS coloring to compare the MAC throughput of each BSS.
IEEE 802.11ax OBSS PD-based Spatial Reuse Operation
In dense IEEE 802.11 networks, multiple BSSs can operate in the same channel due to the limited spectrum. This results in an inefficient paradigm that causes network congestion and slowdown. To optimize efficient reutilization of the frequency spectrum in dense network scenarios, IEEE Std 802.11ax-2021 [1] introduced the OBSS PD-based SR operation. The OBSS PD-based SR operation improves the network performance of BSSs operating in the same channel by increasing the number of parallel transmissions. To increase the number of parallel transmissions, the standard adjusts the clear channel assessment/carrier sense (CCA/CS) threshold for the detected OBSS transmissions to a new value called the OBSS PD threshold. The OBSS PD threshold is higher than the default CCA/CS threshold. This figure illustrates the SR operation in an OBSS. The network topology consists of two BSSs, each containing an AP and an STA.
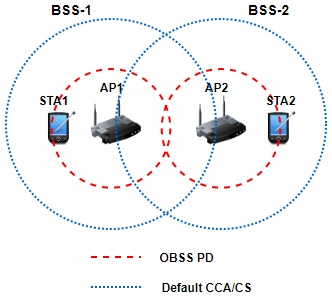
The default CCA/CS threshold (denoted by blue dashed lines) does not enable simultaneous transmissions between AP1 and AP2. If the nodes in BSS-1 occupy the channel for transmission, transmission in BSS-2 is deferred. However, by optimally selecting the value of the OBSS PD threshold (denoted by red dashed lines), both APs can simultaneously transmit to their corresponding STAs. Therefore, the SR operation improves channel utilization, resulting in better throughput.
BSS Coloring
A receiver device identifies a frame as an intra-BSS frame if the color of the detected frame matches with the BSS color of the receiver. If the receiver identifies the frame as an intra-BSS frame, the transmitter and receiver belong to the same BSS and the receiver defers its transmission using the CSMA/CA procedure. If the detected frame color is different from the BSS color, the frame is an inter-BSS frame and the BSS coloring algorithm checks whether the received signal strength indicator (RSSI) of the received frame is greater than the OBSS PD threshold. If the RSSI value of the received frame is greater than the OBSS PD threshold, the device considers the wireless medium as busy and defers its transmission. If the RSSI value of the received frame is less than the OBSS PD threshold, the device ignores the received frame and continues contending for transmission.

Check for Support Package Installation
Check if the Communications Toolbox™ Wireless Network Simulation Library support package is installed. If the support package is not installed, MATLAB® returns an error with a link to download and install the support package.
wirelessnetworkSupportPackageCheck;
Simulate 802.11ax Network with BSS Coloring
This example demonstrates the communication in an 802.11ax network that, by default, has four BSSs, each containing one AP and one station.
Configure Simulation Parameters
Set the seed for the random number generator to 1. The seed value controls the pattern of random number generation. The random number generated by the seed value impacts several processes within the simulation, including backoff counter selection at the MAC layer and predicting packet reception success at the physical layer. To improve the accuracy of your simulation results, after running the simulation, you can change the seed value, run the simulation again and average the results over multiple simulations.
seed = 1;
rng(seed,"combRecursive")
Specify the simulation time in seconds. To visualize a live state transition plot for all of the nodes, set the enablePacketVisualization variable to true.
simulationTime =0.5; enablePacketVisualization =
true;
Configure the number of BSSs to create.
numBSS =  4;
4;Initialize the wireless network simulator by using the wirelessNetworkSimulator object.
networkSimulator = wirelessNetworkSimulator.init;
Configure Nodes
Specify the BSS color for each BSS. A nonzero BSS color enables spatial reuse at the node. Assign a unique BSS color in the device configuration of each AP. Association of STAs to the AP automatically configures the STAs with the BSS color of their corresponding APs. Set the OBSS PD threshold for each BSS. This example uses the same OBSS PD threshold value for all the APs and STAs.
bssColorValues = (1:numBSS);
obssPDThresholdValues = -72*ones(1,numBSS);
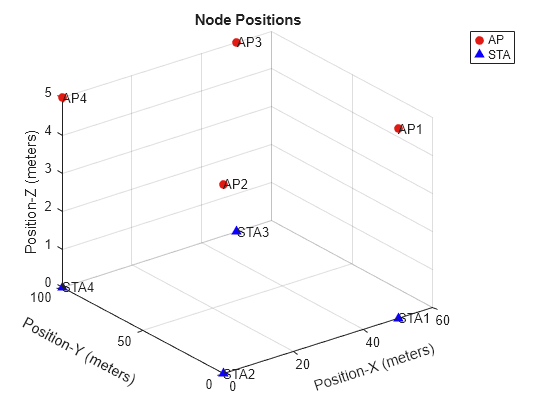
Configure the positions of the AP and STA nodes.
apPositions = zeros(numBSS, 3);
staPositions = zeros(numBSS, 3);
for bssIdx = 1:numBSS
    apPositions(bssIdx, :) = [50*mod(bssIdx,2) 100*(ceil(bssIdx/2)-1) 5];
    staPositions(bssIdx, :) = [50*mod(bssIdx,2) 100*(ceil(bssIdx/2)-1) 0];
end
Visualize the node positions in a 3-D plot by using the hVisualizeNodePositions helper function.
hVisualizeNodePositions(apPositions, staPositions)
To initialize the AP and the STA configuration parameters, create two wlanDeviceConfig objects for each BSS. Specify the Mode, MCS, BSSColor, OBSSPDThreshold, TransmitPower, and DisableRTS values for each AP and STA. Additionally, specify the BSSColor value for each AP. During the association, each STA automatically adopts the same BSS color as its corresponding AP.
Create the AP and STA nodes by using the wlanNode object. Associate each STA to its corresponding AP by using the associateStations object function. Configure the AP with continuous downlink application traffic to its associated STA by using the FullBufferTraffic option of the associateStations object function.
for bssIndex = 1:numBSS
    % Configure AP and STA nodes
    apConfig = wlanDeviceConfig(Mode="AP",MCS=2,BSSColor=bssColorValues(bssIndex),OBSSPDThreshold=obssPDThresholdValues(bssIndex),TransmitPower=7,DisableRTS=true);
    staConfig = wlanDeviceConfig(Mode="STA",MCS=2,OBSSPDThreshold=obssPDThresholdValues(bssIndex),TransmitPower=7,DisableRTS=true);
    % Create AP and STA nodes
    apNodes(bssIndex) = wlanNode(Name=strcat("AP",num2str(bssIndex)),DeviceConfig=apConfig,Position=apPositions(bssIndex,:)); %#ok<*SAGROW>
    staNodes(bssIndex) = wlanNode(Name=strcat("STA",num2str(bssIndex)),DeviceConfig=staConfig,Position=staPositions(bssIndex,:));
    % Associate STAs with AP
    associateStations(apNodes(bssIndex),staNodes(bssIndex),FullBufferTraffic="DL")
end
nodes = [apNodes staNodes];
To ensure all the nodes are configured properly, use the hCheckWLANNodesConfiguration helper function.
hCheckWLANNodesConfiguration(nodes)
For more information about node configuration parameters, see the Get Started with WLAN System-Level Simulation in MATLAB example.
Configure Wireless Channel
To create a random TGax fading channel between each node, this example uses the hSLSTGaxMultiFrequencySystemChannel helper object.
Add the channel model to the wireless network simulator by using the addChannelModel object function of the wirelessNetworkSimulator object.
channel = hSLSTGaxMultiFrequencySystemChannel(nodes);
addChannelModel(networkSimulator,channel.ChannelFcn)
Simulation and Results
Add the nodes to the wireless network simulator.
addNodes(networkSimulator,nodes)
To view the state transition plot, use the helperPlotPacketTransitions helper object. To disable the packet communication over frequency subplot, set the FrequencyPlotFlag property of helperPlotPacketTransitions helper object to false.
if enablePacketVisualization
    helperPlotPacketTransitions(nodes,simulationTime,FrequencyPlotFlag=false);
end
To view the node performance, use the helperPerformanceViewer helper object. The object computes performance metrics such as MAC throughput, application packet latency and MAC packet loss ratio.
perfViewerObj = helperPerformanceViewer(nodes,simulationTime);
Run the simulation for the specified simulation time.
run(networkSimulator,simulationTime)
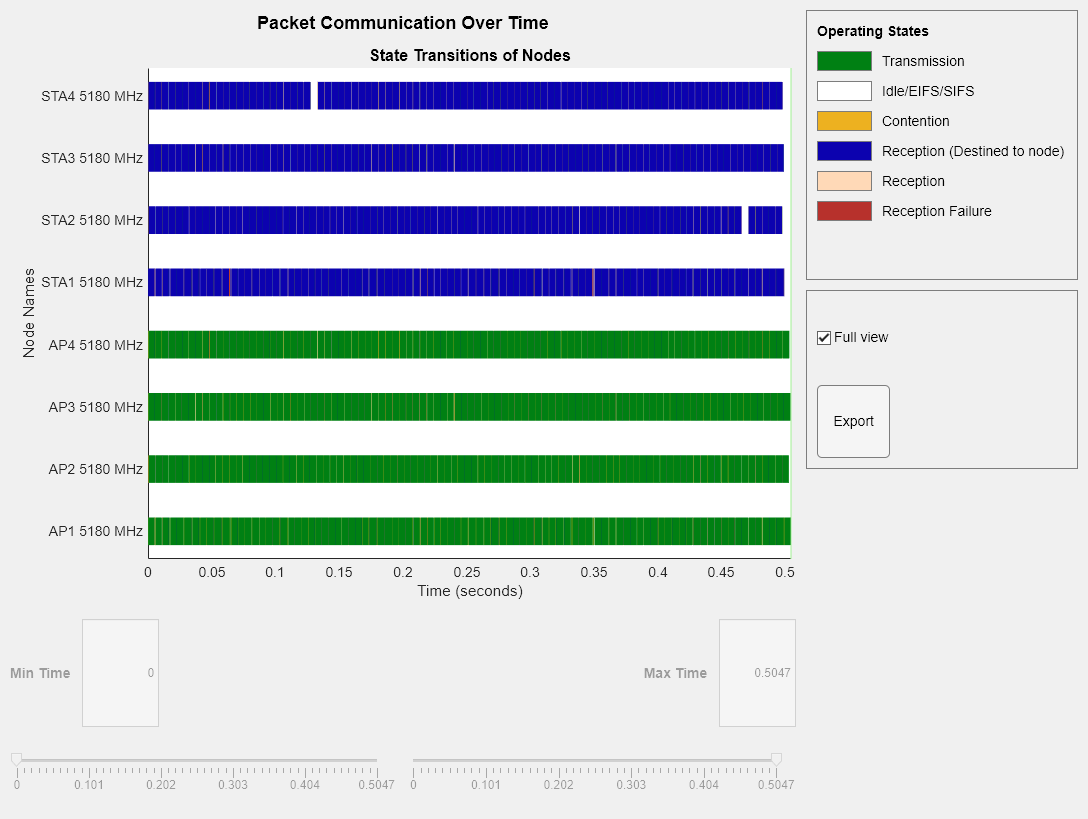
Retrieve the APP, MAC, and PHY statistics at each node by using the statistics object function of the wlanNode object.
statsSR = statistics(nodes);
Calculate the MAC throughput of each AP by using the throughput object function of the helperPerformanceViewer helper object. Store the throughput in the perBSSThroughputSR variable. Because only the APs are transmitters in this example, the throughput of each AP is the same as the throughput of the corresponding BSS.
% Throughput of each AP with SR enabled
perBSSThroughputSR = zeros(1,numBSS);
for bssIndex = 1:numBSS
    perBSSThroughputSR(bssIndex) = throughput(perfViewerObj,apNodes(bssIndex).ID);
end
Simulate 802.11ax Network Without BSS Coloring
In this section of the example, you remove the BSS coloring from the network and simulate it again.
Set the seed of the random number generator to the same value you used in the previous simulation with BSS coloring. This ensures the simulation uses the same random number generation pattern, making it comparable to the previous one.
rng(seed,"combRecursive")Initialize the wireless network simulator.
networkSimulator = wirelessNetworkSimulator.init;
Configure Nodes
To disable SR at each BSS, set the BSS color to 0.
bssColorValues = zeros(1,numBSS);
Specify the BSS color as 0 in the device configurations of the APs and the STAs. Create the AP and STA nodes and associate each STA to its corresponding AP. Configure the AP with continuous downlink application traffic to its associated STA.
for bssIndex = 1:numBSS
    % Configure AP and STA nodes
    apConfig = wlanDeviceConfig(Mode="AP",MCS=2,BSSColor=bssColorValues(bssIndex),TransmitPower=7,DisableRTS=true);
    staConfig = wlanDeviceConfig(Mode="STA",MCS=2,TransmitPower=7,DisableRTS=true);
    % Create AP and STA nodes
    apNodes(bssIndex) = wlanNode(Name=strcat("AP",num2str(bssIndex)),DeviceConfig=apConfig,Position=apPositions(bssIndex,:));
    staNodes(bssIndex) = wlanNode(Name=strcat("STA",num2str(bssIndex)),DeviceConfig=staConfig,Position=staPositions(bssIndex,:));
    % Associate STAs with AP
    associateStations(apNodes(bssIndex),staNodes(bssIndex),FullBufferTraffic="DL")
end
nodes = [apNodes staNodes];
To ensure all the nodes are configured properly, use the hCheckWLANNodesConfiguration helper function.
hCheckWLANNodesConfiguration(nodes)
Configure Wireless Channel
Add the channel model to the wireless network simulator.
channel = hSLSTGaxMultiFrequencySystemChannel(nodes);
addChannelModel(networkSimulator,channel.ChannelFcn)
Simulation and Results
Add the nodes to the wireless network simulator.
addNodes(networkSimulator,nodes)
To view the state transition plot, use the helperPlotPacketTransitions helper object. To disable the packet communication over frequency subplot, set the FrequencyPlotFlag property of helperPlotPacketTransitions helper object to false.
if enablePacketVisualization
    helperPlotPacketTransitions(nodes,simulationTime,FrequencyPlotFlag=false);
end
To view the node performance, use the helperPerformanceViewer helper object. The object computes performance metrics such as MAC throughput, application packet latency and MAC packet loss ratio.
perfViewerObj = helperPerformanceViewer(nodes,simulationTime);
Run the simulation for the specified simulation time.
run(networkSimulator,simulationTime)
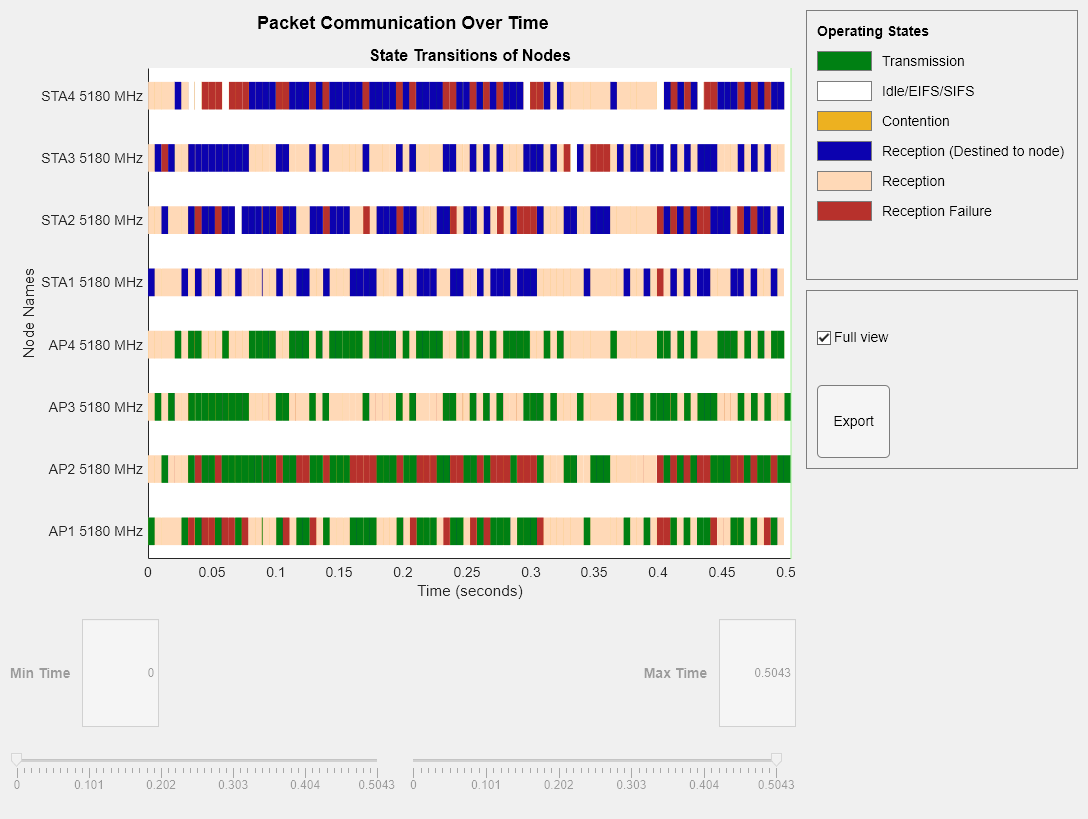
Retrieve the APP, MAC, and PHY statistics at each node by using the statistics object function.
statsNoSR = statistics(nodes);
Calculate the MAC throughput of each AP by using the throughput object function of the helperPerformanceViewer helper object. Store the throughput in the perBSSThroughputNoSR variable. Because only the APs are transmitters in this example, the throughput of each AP is the same as the throughput of the corresponding BSS.
% Throughput of each AP with SR disabled
perBSSThroughputNoSR = zeros(1,numBSS);
for bssIndex = 1:numBSS
    perBSSThroughputNoSR(bssIndex) = throughput(perfViewerObj,apNodes(bssIndex).ID);
end
Compare Throughput With and Without BSS Coloring at Each BSS
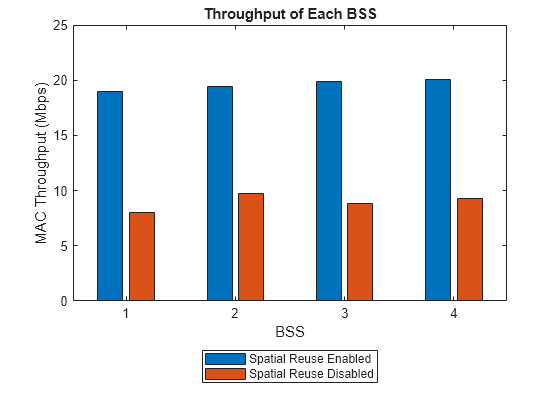
Plot the MAC throughput of each BSS with and without BSS coloring by using the hCompareSRvsNoSRThroughputs helper function. No BSS coloring indicates the SR operation is disabled. Note that the throughput of each BSS improves considerably for the modeled scenario by enabling the SR operation.
hCompareSRvsNoSRThroughputs(perBSSThroughputSR, perBSSThroughputNoSR);
Appendix
The example uses these helper functions and objects.
hCheckWLANNodesConfiguration— Check the node parameters configurationhelperPlotPacketTransitions— Plot the state transition figurehSLSTGaxMultiFrequencySystemChannel— Return a system channel objecthSLSTGaxAbstractSystemChannel— Return a channel manager object for abstracted PHY layerhSLSTGaxSystemChannel— Return a channel manager object for full PHY layerhSLSTGaxSystemChannelBase— Return the base channel manager objecthVisualizeNodePositions— Visualize the node positionshelperPerformanceViewerhCompareSRvsNoSRThroughputs— Retrieve MAC throughput results for scenarios with SR operation enabled and disabled
References
Institute of Electrical and Electronics Engineers (IEEE). IEEE Standard for Information Technology--Telecommunications and Information Exchange between Systems Local and Metropolitan Area Networks--Specific Requirements Part 11: Wireless LAN Medium Access Control (MAC) and Physical Layer (PHY) Specifications Amendment 1: Enhancements for High-Efficiency WLAN. IEEE 802.11ax-2021. IEEE, May 19, 2021. https://doi.org/10.1109/IEEESTD.2021.9442429.