plot
Plot optical flow vectors
Description
plot( plots the optical flow
vectors.flow)
plot(
specifies options using one or more name-value arguments in addition to any
combination of arguments from previous syntaxes. For example,
flow,Name=Value)plot(flow,Color="red") plots the optical flow with red flow
vectors.
Examples
Create an optical flow object from two equal-sized velocity matrices.
Vx = randn(100,100);
Vy = randn(100,100);
opflow = opticalFlow(Vx,Vy);
Inspect the properties of the optical flow object. The orientation and the magnitude are computed from the velocity matrices.
opflow
opflow =
  opticalFlow with properties:

             Vx: [100×100 double]
             Vy: [100×100 double]
    Orientation: [100×100 double]
      Magnitude: [100×100 double]
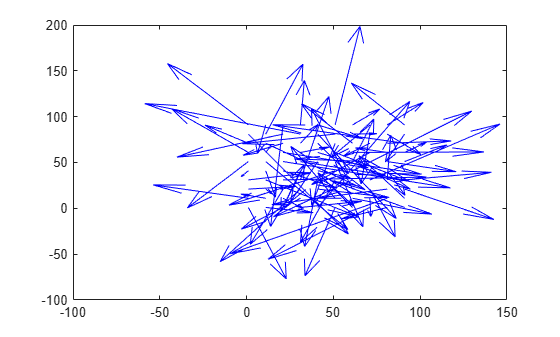
Plot the velocity of the object as a quiver plot.
plot(opflow,DecimationFactor=[10 10],ScaleFactor=10);
Input Arguments
Name-Value Arguments
Version History
Introduced in R2015a