lookupPose
Obtain pose information for certain time
Description
[
returns the pose information of the waypoint trajectory at the specified sample times. If
any sample time is beyond the duration of the trajectory, the corresponding pose information
is returned as position,orientation,velocity,acceleration,angularVelocity] = lookupPose(traj,sampleTimes)NaN.
Examples
Create a waypointTrajectory object that connects two waypoints. The velocity of the trajectory at the two waypoints is 0 and 10 , respectively. Restrict the jerk limit to 0.5 to enable the trapezoidal acceleration profile.
waypoints = [0  0  0;
            10 50 10];
speeds = [0 10];
jerkLimit = 0.5;
trajectory = waypointTrajectory(waypoints,GroundSpeed=speeds,JerkLimit=jerkLimit);
Obtain the initial time and final time of the trajectory by querying the TimeOfArrival property. Create time stamps to sample the trajectory.
t0 = trajectory.TimeOfArrival(1);
tf = trajectory.TimeOfArrival(end);
sampleTimes = linspace(t0,tf,100);
Obtain the position, velocity, and acceleration information at these sampled time stamps using the lookupPose object function.
[position,~,velocity,acceleration,~] = lookupPose(trajectory,sampleTimes);
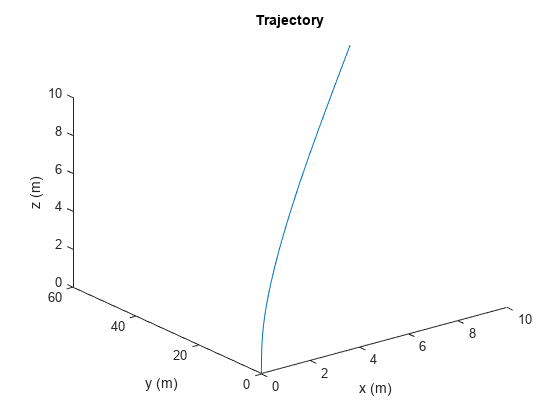
Plot the trajectory.
figure()
plot3(position(:,1),position(:,2),position(:,3))
xlabel("x (m)")
ylabel("y (m)")
zlabel("z (m)")
title("Trajectory")
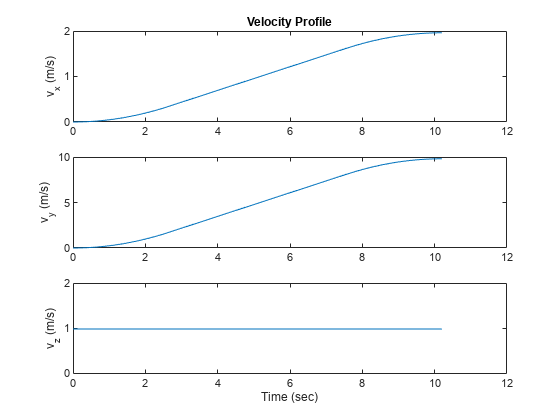
Plot the velocity profile.
figure()
subplot(3,1,1)
plot(sampleTimes,velocity(:,1));
ylabel("v_x (m/s)")
title("Velocity Profile")
subplot(3,1,2)
plot(sampleTimes,velocity(:,2));
ylabel("v_y (m/s)")
subplot(3,1,3)
plot(sampleTimes,velocity(:,3));
ylabel("v_z (m/s)")
xlabel("Time (sec)")
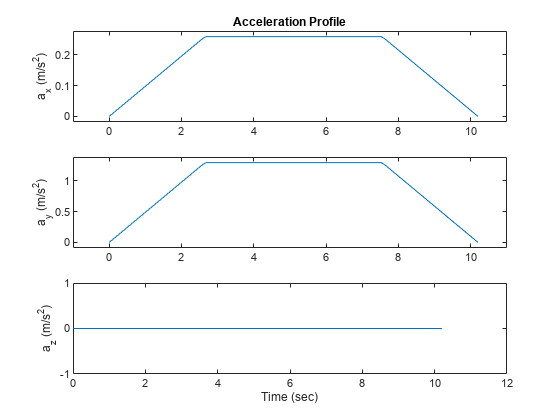
Plot the acceleration profile. From the results, the acceleration profile of the planar motion is trapezoidal.
figure()
subplot(3,1,1)
plot(sampleTimes,acceleration(:,1));
axis padded
ylabel("a_x (m/s^2)")
title("Acceleration Profile")
subplot(3,1,2)
plot(sampleTimes,acceleration(:,2));
ylabel("a_y (m/s^2)")
axis padded
subplot(3,1,3)
plot(sampleTimes,acceleration(:,3));
ylabel("a_z (m/s^2)")
xlabel("Time (sec)")
Input Arguments
Output Arguments
Version History
Introduced in R2020b