Main Content

show

Visualize UAV Dubins path segment

Since R2019b

Description

axHandle = show(pathSegObj) plots the path segment with start and goal positions and the transitions between the motion types.

Note

Plotting uses only the position and the yaw angle.

example

axHandle = show(pathSegObj,Name,Value) specifies additional name-value pair arguments to control display settings.

Examples

collapse all

This example shows how to calculate a UAV Dubins path segment and connect poses using the uavDubinsConnection object.

Create a uavDubinsConnection object.

connectionObj = uavDubinsConnection;

Define start and goal poses as [x, y, z, headingAngle] vectors.

startPose = [0 0 0 0]; % [meters, meters, meters, radians]
goalPose = [0 0 20 pi];

Calculate a valid path segment and connect the poses. Returns a path segment object with the lowest path cost.

[pathSegObj,pathCosts] = connect(connectionObj,startPose,goalPose);

Show the generated path.

show(pathSegObj{1})

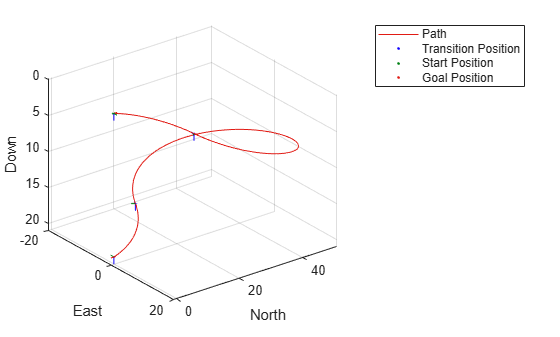
Display the motion type and the path cost of the generated path.

fprintf('Motion Type: %s\nPath Cost: %f\n',strjoin(pathSegObj{1}.MotionTypes),pathCosts);
Motion Type: R L R N
Path Cost: 138.373157

Input Arguments

collapse all

Path segment, specified as a uavDubinsPathSegment object.

Name-Value Arguments

Specify optional pairs of arguments as Name1=Value1,...,NameN=ValueN, where Name is the argument name and Value is the corresponding value. Name-value arguments must appear after other arguments, but the order of the pairs does not matter.

Before R2021a, use commas to separate each name and value, and enclose Name in quotes.

Example: 'Positions',{'start','goal'}

Axes used to plot path, specified as the comma-separated pair consisting of 'Parent' and an axes object.

Example: 'Parent',axHandle

Positions to display, specified as the comma-separated pair consisting of 'Positions' and a cell array of string or character vectors or a vector of string scalars.

Options are any combination of 'start', 'goal', and 'transitions'.

To disable all position displays, specify either as an empty cell array {} or empty vector [].

Output Arguments

collapse all

Axes used to plot path, returned as an axes object.

Version History

Introduced in R2019b