Visualize Word Frequency in a Word Cloud
This example shows how to visualize the distribution of text using Text Analytics Toolbox™ in a word cloud. Use ThingSpeak™ to sort the text and see what parameters influence the distribution, or sentiment.
CheerLights allows people across the world to synchronize to one color set by social media interfaces. ThingSpeak Channel 1417 stores the history of CheerLights colors. Read words from the ThingSpeak channel and compare the distribution for early and late time stamps.
Read Text Data and Calculate Word Frequency
Read the last 500 data points from the CheerLights ThingSpeak channel. Find the frequency of words in each document of a collection using the bagofwords function in the Text Analytics Toolbox.
colorData = thingSpeakRead(1417,'numPoints',500,'OutputFormat','Timetable','fields', [1]);
bagOfWords(colorData.LastCheerLightsCommand')
ans =

  bagOfWords with properties:

          Counts: [61 68 40 59 23 42 52 59 40 46 10]
      Vocabulary: [1×11 string]
        NumWords: 11
    NumDocuments: 1
Sort Results by Time
Find the index of each data point with a timestamp earlier than lunchtime, and then find all the indexes for data points after lunch. Use the indexes to create an array of all the words for each case.
lateTimeIndex = (hour(colorData.Timestamps) > 12);
earlyTimeIndex = (hour(colorData.Timestamps) < 12);

lateColors = colorData.LastCheerLightsCommand(lateTimeIndex);
earlyColors = colorData.LastCheerLightsCommand(earlyTimeIndex);
Compare Word Frequency in Word Cloud
Use the sorted data to generate the word clouds. The subplot function allows you to compare them side by side.
subplot(1,2,1);
earlyWordCloud = wordcloud(earlyColors,'Color','blue')
title('Early Morning CheerLights');

subplot(1,2,2);
lateWordCloud = wordcloud(lateColors,'color','green')
title('Late Night CheerLights');
earlyWordCloud =

  WordCloudChart with properties:

           WordData: [1×11 string]
           SizeData: [67 60 58 58 49 46 42 40 40 22 10]
    MaxDisplayWords: 100

  Use GET to show all properties


lateWordCloud =

  WordCloudChart with properties:

           WordData: ["cyan"    "magenta"    "red"    "white"]
           SizeData: [1 1 1 1]
    MaxDisplayWords: 100

  Use GET to show all properties
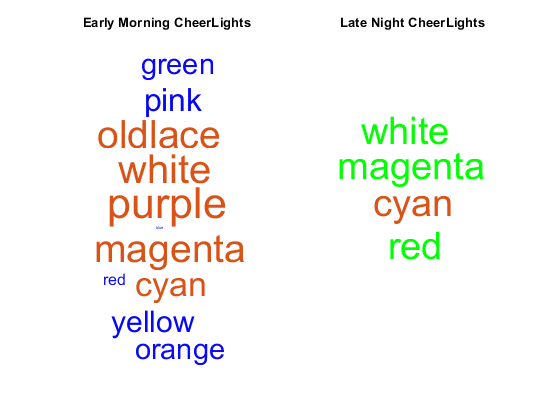
The distribution of colors sent to CheerLights appears to depend only loosely on the time of day of the posting. Some colors are strong only in the afternoon, and some are consistently strong all day.
See Also
Get Started with Text Analytics Toolbox (Text Analytics Toolbox) | wordcloud (Text Analytics Toolbox)