Visualize Abrupt Changes in Signals
This example shows how to determine changes or breakouts in signals using change-point detection. Change-point detection tries to identify times when the probability distribution of a stochastic process or time series changes.
Read Data
Read the wind speed at the MathWorks campus stored in channel 12397 using the thingSpeakRead function.
data = thingSpeakRead(12397,'Fields',2,'NumPoints',1000);
Visualize Change Points
Air moving from a high-pressure area to a low-pressure area determines the wind speed. The change in pressure is usually due to changes in ambient temperature. The anemometer installed as a part of the MathWorks Weather Station measures wind speed and writes to ThingSpeak channel 12397.
While instantaneous wind speed is expected to change frequently, the average wind speed is a better indicator of weather conditions. The findchangepts function attempts to find the points where the average wind speed changes abruptly and plots any detected changes.
findchangepts(data,'Statistic','mean');
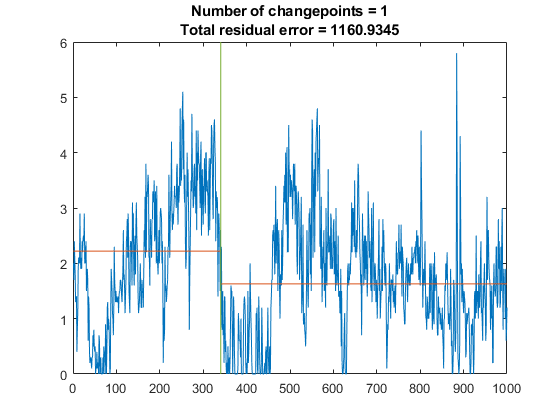
The plot shows if there are points where the mean of the wind speed changed. Since the weatherstation data is live data, there may be no change points in the data you read.
See Also
Functions
findchangepts(Signal Processing Toolbox) |thingSpeakRead