Main Content

vartestn

Multiple-sample tests for equal variances

Description

vartestn(x) returns a summary table of statistics and a box plot for a Bartlett test of the null hypothesis that the columns of data vector x come from normal distributions with the same variance. The alternative hypothesis is that not all columns of data have the same variance.

example

vartestn(x,Name,Value) returns a summary table of statistics and a box plot for a test of unequal variances with additional options specified by one or more name-value pair arguments. For example, you can specify a different type of hypothesis test or change the display settings for the test results.

example

vartestn(x,group) returns a summary table of statistics and a box plot for a Bartlett test of the null hypothesis that the data in each categorical group comes from normal distributions with the same variance. The alternative hypothesis is that not all groups have the same variance.

example

vartestn(x,group,Name,Value) returns a summary table of statistics and a box plot for a test of unequal variances with additional options specified by one or more name-value pair arguments. For example, you can specify a different type of hypothesis test or change the display settings for the test results.

example

p = vartestn(___) also returns the p-value of the test, p, using any of the input arguments in the previous syntaxes.

example

[p,stats] = vartestn(___) also returns the structure stats containing information about the test statistic.

example

Examples

collapse all

Load the sample data.

load examgrades

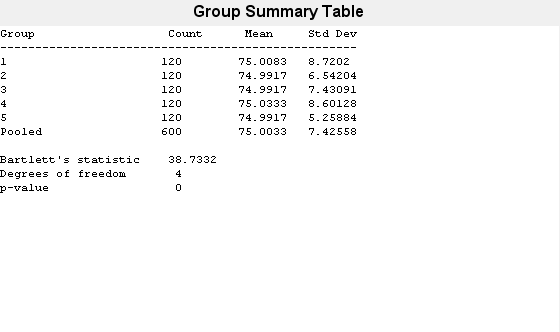
Test the null hypothesis that the variances are equal across the five columns of data in the students’ exam grades matrix, grades.

vartestn(grades)

Figure Variance Test contains objects of type uicontrol.

Figure contains an axes object. The axes object contains 35 objects of type line. One or more of the lines displays its values using only markers

ans = 
7.9086e-08

The low p-value, p = 0, indicates that vartestn rejects the null hypothesis that the variances are equal across all five columns, in favor of the alternative hypothesis that at least one column has a different variance.

Load the sample data.

load carsmall

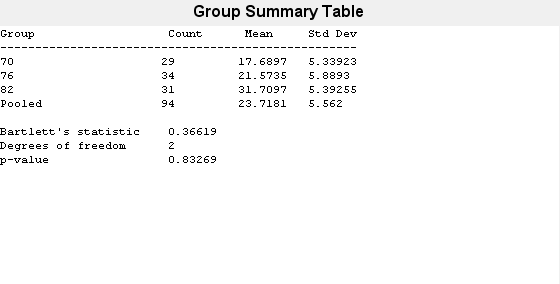
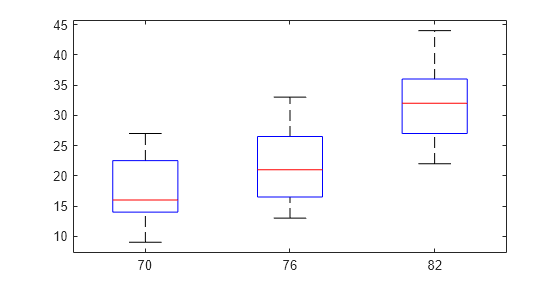
Test the null hypothesis that the variances in miles per gallon (MPG) are equal across different model years.

vartestn(MPG,Model_Year)

Figure Variance Test contains objects of type uicontrol.

Figure contains an axes object. The axes object contains 21 objects of type line. One or more of the lines displays its values using only markers

ans = 
0.8327

The high p-value, p = 0.83269, indicates that vartestn does not reject the null hypothesis that the variances in miles per gallon (MPG) are equal across different model years.

Load the sample data.

load carsmall

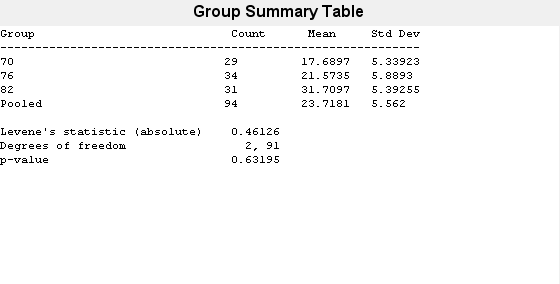
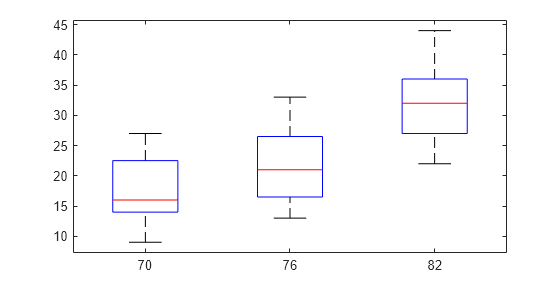
Use Levene’s test to test the null hypothesis that the variances in miles per gallon (MPG) are equal across different model years.

p = vartestn(MPG,Model_Year,'TestType','LeveneAbsolute')

Figure Variance Test contains objects of type uicontrol.

Figure contains an axes object. The axes object contains 21 objects of type line. One or more of the lines displays its values using only markers

p = 
0.6320

The high p-value, p = 0.63195, indicates that vartestn does not reject the null hypothesis that the variances in miles per gallon (MPG) are equal across different model years.

Load the sample data.

load examgrades

Test the null hypothesis that the variances are equal across the five columns of data in the students’ exam grades matrix, grades, using the Brown-Forsythe test. Suppress the display of the summary table of statistics and the box plot.

[p,stats] = vartestn(grades,'TestType','BrownForsythe','Display','off')
p = 
1.3121e-06
stats = struct with fields:
    fstat: 8.4160
       df: [4 595]

The small p-value, p = 1.3121e-06, indicates that vartestn rejects the null hypothesis that the variances are equal across all five columns, in favor of the alternative hypothesis that at least one column has a different variance.

Input Arguments

collapse all

Sample data, specified as a matrix or column vector. If a grouping variable group is specified, then x must be a column vector. If a grouping variable is not specified, x must be a matrix. In either case, vartestn treats NaN values as missing values and ignores them.

Data Types: single | double

Grouping variable, specified as a categorical array, logical or numeric vector, character array, string array, or cell array of character vectors with one row for each element of x. Each unique value in a grouping variable defines a group. vartestn treats NaN values as missing values and ignores them.

For example, if Gender is a cell array of character vectors with values 'Male' and 'Female', you can use Gender as a grouping variable to test your data by gender.

Example: Gender

Data Types: categorical | single | double | logical | string | cell | char

Name-Value Arguments

Specify optional pairs of arguments as Name1=Value1,...,NameN=ValueN, where Name is the argument name and Value is the corresponding value. Name-value arguments must appear after other arguments, but the order of the pairs does not matter.

Before R2021a, use commas to separate each name and value, and enclose Name in quotes.

Example: 'TestType','BrownForsythe','Display','off' specifies a Brown-Forsythe test and omits the plot of the results.

Display settings for test results, specified as the comma-separated pair consisting of 'Display' and one of the following.

'on'Display a box plot and table of summary statistics.
'off'Do not display a box plot and table of summary statistics.

Example: 'display','off'

Type of hypothesis test to perform, specified as the comma-separated pair consisting of 'TestType' and one of the following.

'Bartlett'Bartlett’s test.
'LeveneQuadratic'Levene’s test computed by performing ANOVA on the squared deviations of the data values from their group means.
'LeveneAbsolute'Levene’s test computed by performing ANOVA on the absolute deviations of the data values from their group means.
'BrownForsythe'Brown-Forsythe test computed by performing ANOVA on the absolute deviations of the data values from the group medians.
'OBrien'O’Brien’s modification of Levene’s test with W = 0.5.

Example: 'TestType','OBrien'

Output Arguments

collapse all

p-value of the test, returned as a scalar value in the range [0,1]. p is the probability of observing a test statistic that is as extreme as, or more extreme than, the observed value under the null hypothesis. A small value of p indicates that the null hypothesis might not be valid.

Test statistics for the hypothesis test, returned as a structure containing:

  • chistat: Value of the test statistic.

  • df: Degrees of freedom of the test.

More About

collapse all

Bartlett’s Test

Bartlett’s test is used to test whether multiple data samples have equal variances, against the alternative that at least two of the data samples do not have equal variances.

The test statistic is

T=(Nk)lnsp2i=1k(Ni1)lnsi21+(1/(3(k1)))((i=1k1/(Ni1))1/(Nk)),

where si2 is the variance of the ith group, N is the total sample size, Ni is the sample size of the ith group, k is the number of groups, and sp2 is the pooled variance. The pooled variance is defined as

sp2=i=1k(Ni1)si2/(Nk).

The test statistic has a chi-square distribution with k – 1 degrees of freedom under the null hypothesis.

Bartlett’s test is sensitive to departures from normality. If your data comes from a nonnormal distribution, Levene’s test could provide a more accurate result.

Levene, Brown-Forsythe, and O’Brien Tests

The Levene, Brown-Forsythe, and O’Brien tests are used to test if multiple data samples have equal variances, against the alternative that at least two of the data samples do not have equal variances.

The test statistic is

W=(Nk)i=1kNi(Z¯i.Z¯..)2(k1)i=1kj=1Ni(ZijZ¯i.)2,

where Ni is the sample size of the ith group, and k is the number of groups. Depending on the type of test specified with the TestType name-value pair arguments, Zij can have one of four definitions:

  • If you specify LeveneAbsolute, vartestn uses Zij=|YijY¯i.|, where Y¯i. is the mean of the ith subgroup.

  • If you specify LeveneQuadratic, vartestn uses Zij2=(YijY¯i.)2, where Y¯i. is the mean of the ith subgroup.

  • If you specify BrownForsythe, vartestn uses Zij=|YijY˜i.|, where Y˜i. is the median of the ith subgroup.

  • If you specify OBrien, vartestn uses

    Zij=(0.5+ni2)ni(yijy¯i)20.5(ni1)σi2(ni1)(ni2),

    where ni is the size of the ith group, σi2 is its sample variance.

In all cases, the test statistic has an F-distribution with k – 1 numerator degrees of freedom, and Nk denominator degrees of freedom.

The Levene, Brown-Forsythe, and O’Brien tests are less sensitive to departures from normality than Bartlett’s test, so they are useful alternatives if you suspect the samples come from nonnormal distributions.

Version History

Introduced before R2006a
See Also

| |