Main Content

skewness

Description

y = skewness(X) returns the sample skewness of X.

  • If X is a vector, then skewness(X) returns a scalar value that is the skewness of the elements in X.

  • If X is a matrix, then skewness(X) returns a row vector containing the sample skewness of each column in X.

  • If X is a multidimensional array, then skewness(X) operates along the first nonsingleton dimension of X.

example

y = skewness(X,flag) specifies whether to correct for bias (flag = 0) or not (flag = 1, the default). When X represents a sample from a population, the skewness of X is biased, meaning it tends to differ from the population skewness by a systematic amount based on the sample size. You can set flag to 0 to correct for this systematic bias.

example

y = skewness(X,flag,'all') returns the skewness of all elements of X.

example

y = skewness(X,flag,dim) returns the skewness along the operating dimension dim of X.

example

y = skewness(X,flag,vecdim) returns the skewness over the dimensions specified in the vector vecdim. For example, if X is a 2-by-3-by-4 array, then skewness(X,1,[1 2]) returns a 1-by-1-by-4 array. Each element of the output array is the biased skewness of the elements on the corresponding page of X.

example

Examples

collapse all

Set the random seed for reproducibility of the results.

rng('default')

Generate a matrix with 5 rows and 4 columns.

X = randn(5,4)
X = 5×4

    0.5377   -1.3077   -1.3499   -0.2050
    1.8339   -0.4336    3.0349   -0.1241
   -2.2588    0.3426    0.7254    1.4897
    0.8622    3.5784   -0.0631    1.4090
    0.3188    2.7694    0.7147    1.4172

Find the sample skewness of X.

y = skewness(X)
y = 1×4

   -0.9362    0.2333    0.4363   -0.4075

y is a row vector containing the sample skewness of each column in X.

For an input vector, correct for bias in the calculation of skewness by specifying the flag input argument.

Set the random seed for reproducibility of the results.

rng('default') 

Generate a vector of length 10.

x = randn(10,1)
x = 10×1

    0.5377
    1.8339
   -2.2588
    0.8622
    0.3188
   -1.3077
   -0.4336
    0.3426
    3.5784
    2.7694

Find the biased skewness of x. By default, skewness sets the value of flag to 1 for computing the biased skewness.

y1 = skewness(x) % flag is 1 by default
y1 = 
0.1061

Find the bias-corrected skewness of x by setting the value of flag to 0.

y2 = skewness(x,0)
y2 = 
0.1258

Find the skewness along different dimensions for a multidimensional array.

Set the random seed for reproducibility of the results.

rng('default') 

Create a 4-by-3-by-2 array of random numbers.

X = randn([4,3,2])
X = 
X(:,:,1) =

    0.5377    0.3188    3.5784
    1.8339   -1.3077    2.7694
   -2.2588   -0.4336   -1.3499
    0.8622    0.3426    3.0349


X(:,:,2) =

    0.7254   -0.1241    0.6715
   -0.0631    1.4897   -1.2075
    0.7147    1.4090    0.7172
   -0.2050    1.4172    1.6302

Find the skewness of X along the default dimension.

Y1 = skewness(X)
Y1 = 
Y1(:,:,1) =

   -0.8084   -0.5578   -1.0772


Y1(:,:,2) =

   -0.0403   -1.1472   -0.6632

By default, skewness operates along the first dimension of X whose size does not equal 1. In this case, this dimension is the first dimension of X. Therefore, Y1 is a 1-by-3-by-2 array.

Find the biased skewness of X along the second dimension.

Y2 = skewness(X,1,2)
Y2 = 
Y2(:,:,1) =

    0.6956
   -0.5575
    0.0049
    0.6033


Y2(:,:,2) =

   -0.6969
    0.1828
    0.7071
   -0.6714

Y2 is a 4-by-1-by-2 array.

Find the biased skewness of X along the third dimension.

Y3 = skewness(X,1,3)
Y3 = 4×3
10-15 ×

         0    0.1597    0.5062
    0.1952         0         0
         0   -0.2130         0
    0.3654         0    0.4807

Y3 is a 4-by-3 matrix.

Find the skewness over multiple dimensions by using the 'all' and vecdim input arguments.

Set the random seed for reproducibility of the results.

rng('default')

Create a 4-by-3-by-2 array of random numbers.

X = randn([4 3 2])
X = 
X(:,:,1) =

    0.5377    0.3188    3.5784
    1.8339   -1.3077    2.7694
   -2.2588   -0.4336   -1.3499
    0.8622    0.3426    3.0349


X(:,:,2) =

    0.7254   -0.1241    0.6715
   -0.0631    1.4897   -1.2075
    0.7147    1.4090    0.7172
   -0.2050    1.4172    1.6302

Find the biased skewness of X.

yall = skewness(X,1,'all')
yall = 
0.0916

yall is the biased skewness of the entire input data set X.

Find the biased skewness of each page of X by specifying the first and second dimensions.

ypage = skewness(X,1,[1 2])
ypage = 
ypage(:,:,1) =

    0.1070


ypage(:,:,2) =

   -0.6263

For example, ypage(1,1,2) is the biased skewness of the elements in X(:,:,2).

Find the biased skewness of the elements in each X(:,i,:) slice by specifying the first and third dimensions.

ycol = skewness(X,1,[1 3])
ycol = 1×3

   -1.0755   -0.3108   -0.2209

For example, ycol(3) is the biased skewness of the elements in X(:,3,:).

Input Arguments

collapse all

Input data that represents a sample from a population, specified as a vector, matrix, or multidimensional array.

  • If X is a vector, then skewness(X) returns a scalar value that is the skewness of the elements in X.

  • If X is a matrix, then skewness(X) returns a row vector containing the sample skewness of each column in X.

  • If X is a multidimensional array, then skewness(X) operates along the first nonsingleton dimension of X.

To specify the operating dimension when X is a matrix or an array, use the dim input argument.

skewness treats NaN values in X as missing values and removes them.

Data Types: single | double

Indicator for the bias, specified as 0 or 1.

  • If flag is 1 (default), then the skewness of X is biased, meaning it tends to differ from the population skewness by a systematic amount based on the sample size.

  • If flag is 0, then skewness corrects for the systematic bias.

Data Types: single | double | logical

Dimension along which to operate, specified as a positive integer. If you do not specify a value for dim, then the default is the first dimension of X whose size does not equal 1.

Consider the skewness of a matrix X:

  • If dim is equal to 1, then skewness returns a row vector that contains the sample skewness of each column in X.

  • If dim is equal to 2, then skewness returns a column vector that contains the sample skewness of each row in X.

If dim is greater than ndims(X) or if size(X,dim) is 1, then skewness returns an array of NaNs the same size as X.

Data Types: single | double

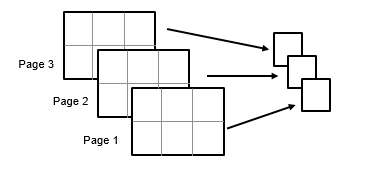
Vector of dimensions, specified as a positive integer vector. Each element of vecdim represents a dimension of the input array X. The output y has length 1 in the specified operating dimensions. The other dimension lengths are the same for X and y.

For example, if X is a 2-by-3-by-3 array, then skewness(X,1,[1 2]) returns a 1-by-1-by-3 array. Each element of the output array is the biased skewness of the elements on the corresponding page of X.

Mapping of input dimension of 2-by-3-by-3 to output dimension of 1-by-1-by-3

Data Types: single | double

Output Arguments

collapse all

Skewness, returned as a scalar, vector, matrix, or multidimensional array.

Algorithms

Skewness is a measure of the asymmetry of the data around the sample mean. If skewness is negative, the data spreads out more to the left of the mean than to the right. If skewness is positive, the data spreads out more to the right. The skewness of the normal distribution (or any perfectly symmetric distribution) is zero.

The skewness of a distribution is defined as

s=E(xμ)3σ3,

where µ is the mean of x, σ is the standard deviation of x, and E(t) represents the expected value of the quantity t. The skewness function computes a sample version of this population value.

When you set flag to 1, the skewness is biased, and the following equation applies:

s1=1ni=1n(xix¯)3(1ni=1n(xix¯)2)3.

When you set flag to 0, skewness corrects for the systematic bias, and the following equation applies:

s0=n(n1)n2s1.

This bias-corrected equation requires that X contain at least three elements.

Extended Capabilities

Version History

Introduced before R2006a