probplot
Probability plots
Syntax
Description
probplot( creates a normal
probability plot comparing the distribution of the data in
y)y to the normal distribution.
probplot plots each data point in
y using marker symbols and draws a reference line that
represents the theoretical distribution. If the sample data has a normal
distribution, then the data points appear along the reference line. The
reference line connects the first and third quartiles of the data and extends to
the ends of the data. A distribution other than normal introduces curvature in
the data plot.
probplot( adds a
probability plot into the existing probability plot axes specified by
ax,___)ax, using any of the input arguments in the previous
syntaxes.
probplot(___,'noref') omits the reference
line from the plot.
Examples
Generate sample data and create a probability plot.
Generate sample data. The sample x1 contains 500 random numbers from a Weibull distribution with scale parameter A = 3 and shape parameter B = 3. The sample x2 contains 500 random numbers from a Rayleigh distribution with scale parameter B = 3.
rng('default');  % For reproducibility
x1 = wblrnd(3,3,[500,1]);
x2 = raylrnd(3,[500,1]);
Create a probability plot to assess whether the data in x1 and x2 comes from a Weibull distribution.
figure
probplot('weibull',[x1 x2])
legend('Weibull Sample','Rayleigh Sample','Location','best')
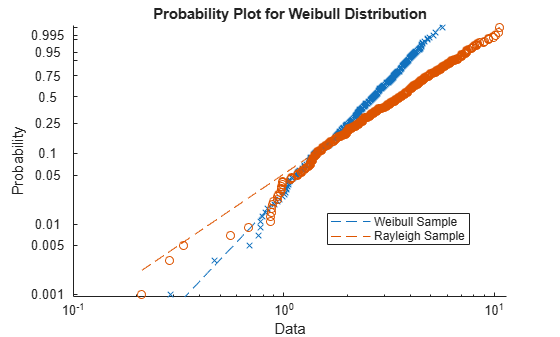
The probability plot shows that the data in x1 comes from a Weibull distribution, while the data in x2 does not.
Alternatively, you can use wblplot to create a Weibull probability plot.
Create a probability plot and an additional fitted line on the same figure.
Generate sample data containing about 20% outliers in the tails. The left tail of the sample data contains 10 values randomly generated from an exponential distribution with parameter mu = 1. The right tail contains 10 values randomly generated from an exponential distribution with parameter mu = 5. The center of the sample data contains 80 values randomly generated from a standard normal distribution.
rng('default')  % For reproducibility
left_tail = -exprnd(1,10,1);
right_tail = exprnd(5,10,1);
center = randn(80,1);
data = [left_tail;center;right_tail];
Create a probability plot to assess whether the sample data comes from a normal distribution.
probplot(data)
Plot a t location-scale curve on the same figure to compare with data.
p = mle(data,'distribution','tLocationScale');
t = @(data,mu,sig,df)cdf('tLocationScale',data,mu,sig,df);
h = probplot(gca,t,p);
h.Color = 'r';
h.LineStyle = '-';
title('{\bf Probability Plot}')
legend('Normal','Data','t','Location','NW')
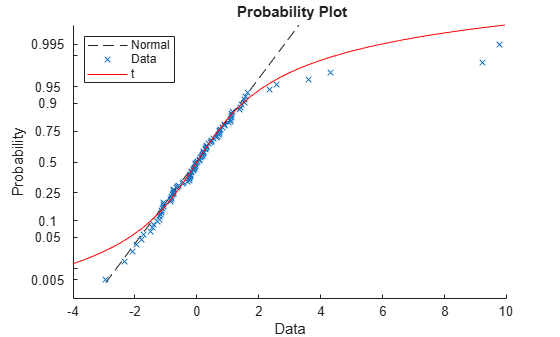
The plot shows that neither the normal line nor the t location-scale curve fits the tails very well because of the outliers.
Create a half-normal probability distribution plot to identify significant effects in an experiment to study factors that might influence flow rate in a chemical manufacturing process. The four factors are reactants A, B, C, and D. Each factor is present at two levels (high and low concentration). The experiment contains only one replication at each factor level.
Load the sample data.
load flowrateThe first four columns of the table flowrate contain the design matrix for the factors and their interactions. The design matrix is coded to use 1 for the high factor level and -1 for the low factor level. The fifth column of flowrate contains the measured flow rate.
Fit a linear regression model using rate as the response variable. Use predictor variables A, B, C, D, and all of their interaction terms.
mdl = fitlm(flowrate,'rate ~ A*B*C*D');Calculate and store the absolute value of the factor effect estimates. To obtain the factor effect estimates, multiply the coefficient estimates obtained during the model fitting by two. This step is necessary because the regression coefficients measure the effect of a one-unit change in x on the mean of y. However, the effects estimates measure a two-unit change in x due to the design matrix coding of -1 and 1. Exclude the baseline measurement. Note that the factor order in mdl may be different from the order in the original design matrix.
effects = abs(mdl.Coefficients{2:end,1}*2);Create a half-normal probability plot using the absolute value of the effects estimates, excluding the baseline.
figure
h = probplot('halfnormal',effects);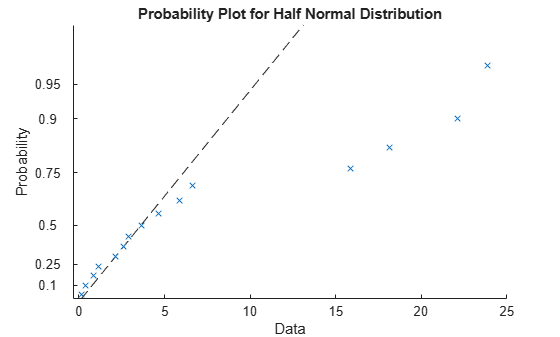
Label the points and format the plot. First, return the index values for the sorted effects estimates (from lowest to highest). Then use these index values to sort the probability values stored in the graphics handle (h(1).YData).
[b,i] = sort(effects);
prob(i) = h(1).YData;
Add text labels to the plot at each point. For each point, the x-value is the effects estimate and the y-value is the corresponding probability.
text(effects,prob,mdl.CoefficientNames(2:end),'FontSize',8,...
    'VerticalAlignment','top')
h(1).Color = 'r';
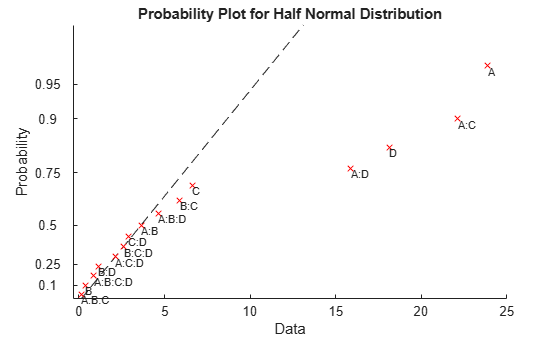
The points located far from the reference line represent the significant effects.
Generate simulated frequency data.
y = 1:10;
freq = [2 4 6 7 9 8 7 7 6 5];
Create a normal probability plot using the frequency data.
probplot(y,[],freq)
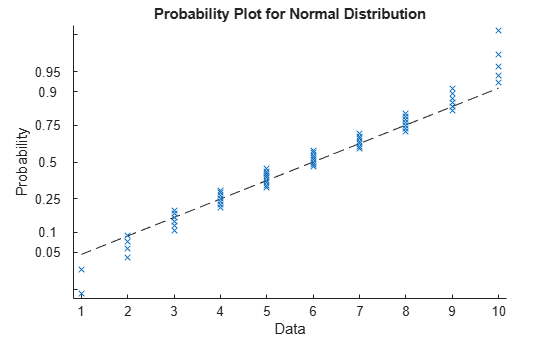
The normal probability plot shows that the data do not have a normal distribution.
Input Arguments
Output Arguments
Algorithms
probplot matches the quantiles of sample data to the quantiles of
a given probability distribution. The sample data is sorted, scaled according to the
choice of dist, and plotted on the x-axis. When
dist is 'lognormal',
'loglogistic', or 'weibull', the scaling is
logarithmic. Otherwise, the scaling is linear. The y-axis represents the quantiles of
the distribution specified in dist, converted into probability
values. The scaling depends on the given distribution and is not linear.
Where the x-axis value is the ith sorted value from a sample of size N, the y-axis value is the midpoint between evaluation points of the empirical cumulative distribution function of the data. In the case of uncensored data, the midpoint is equal to .
probplot superimposes a reference line to assess the linearity of
the plot. If the data is uncensored, then the line goes through the first and third
quartiles of the data. If the data is censored, then the line shifts accordingly. If the
data is uncensored and dist is 'half normal', then
probplot uses the zeroth and second quartiles instead.
Version History
Introduced before R2006a