multcompare
Multiple comparison test
Syntax
Description
c = multcompare(stats)c of the pairwise comparison results from a multiple
comparison test using the information contained in the stats structure.
multcompare also displays an interactive graph of the estimates and
comparison intervals. Each group mean is represented by a symbol, and the interval is
represented by a line extending out from the symbol. Two group means are significantly different
if their intervals are disjoint; they are not significantly different if their intervals
overlap. If you use your mouse to select any group, then the graph will highlight all other
groups that are significantly different, if any.
c = multcompare(stats,Name,Value)
Examples
Load the carsmall data set.
load carsmallThe data contains miles per gallon (MPG) measurements for different makes and models of cars, grouped by the country of origin (Origin) and other vehicle characteristics.
Perform a one-way analysis of variance (ANOVA) to see if the MPG values of the cars are different depending on the country of origin.
[p,t,stats] = anova1(MPG,Origin);
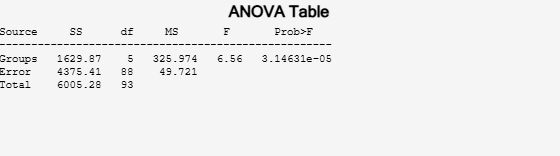
The small p-value (value in the column Prob>F) indicates that group mean differences are significant. However, the ANOVA results do not indicate which groups have different means. You can perform pairwise comparisons using a multiple comparison test to identify the groups that have significantly different means.
Perform a multiple comparison test of the group means.
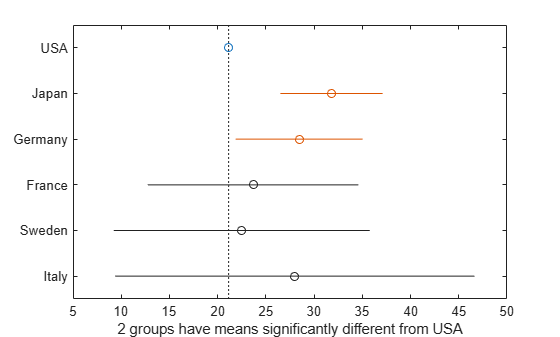
[c,m,h,gnames] = multcompare(stats);

multcompare displays the estimates with comparison intervals around them. You can click the graph of any country to compare its mean to those of other countries.
Display the mean estimates, standard errors, and corresponding group names in a table.
tbl = array2table(m,"RowNames",gnames, ...
    "VariableNames",["Mean","Standard Error"])
tbl=6×2 table
                Mean     Standard Error
               ______    ______________

    USA        21.133       0.88141
    Japan        31.8        1.8206
    Germany    28.444        2.3504
    France     23.667        4.0711
    Sweden       22.5         4.986
    Italy          28        7.0513
Perform a multiple comparison test against a control group using Dunnett's test, and compare the results to the pairwise comparison results from Tukey’s honestly significant difference procedure.
Load the carsmall data set.
load carsmallThe data contains miles per gallon (MPG) measurements for different makes and models of cars, grouped by the country of origin (Origin) and other vehicle characteristics.
Perform a one-way ANOVA to compare the mileage of the cars across the groups defined by their countries of origin.
[~,~,stats] = anova1(MPG,Origin,"off");Display the names of the groups.
stats.gnames
ans = 6×1 cell
    {'USA'    }
    {'Japan'  }
    {'Germany'}
    {'France' }
    {'Sweden' }
    {'Italy'  }
According to the multiple comparison results for all distinct pairs of groups in the Multiple Comparisons of Group Means example, USA and Japan have significantly different means. The example uses the default test, Tukey’s honestly significant difference procedure.
Compare the group means against a control group by using Dunnett's test.
Specify CriticalValueType as "dunnett" to perform Dunnett's test. multcompare selects the first group (USA) as the control group by default. You can select a different control group by using the ControlGroup name-value argument.
[results,~,~,gnames] = multcompare(stats,"CriticalValueType","dunnett");
In the figure, the blue circle indicates the mean of the control group. The red circles and bars represent the means and confidence intervals for the groups with significantly different means from the mean of the control group. Note that the red bars do not cross the dotted vertical line representing the mean of the control group. Groups that do not have significantly different means appear in grey.
Dunnett's test identifies that two groups, Japan and Germany, have means that are significantly different from the mean of the USA (control group). Note that the default procedure (Tukey’s honestly significant difference procedure) did not identify Germany in the Multiple Comparisons of Group Means example. The difference in the results is related to the different levels of conservativeness in the two comparison tests. Dunnett's test is less conservative than the default procedure because the test considers only the comparisons against a control group. The default procedure performs pairwise comparisons for all distinct pairs of groups.
Display the multiple comparison results and the corresponding group names in a table.
tbl = array2table(results,"VariableNames", ...
    ["Group","Control Group","Lower Limit","Difference","Upper Limit","P-value"]);
tbl.("Group") = gnames(tbl.("Group"));
tbl.("Control Group") = gnames(tbl.("Control Group"))
tbl=5×6 table
       Group       Control Group    Lower Limit    Difference    Upper Limit     P-value
    ___________    _____________    ___________    __________    ___________    _________

    {'Japan'  }       {'USA'}          5.3649        10.667        15.969       4.727e-06
    {'Germany'}       {'USA'}         0.73151        7.3116        13.892        0.022346
    {'France' }       {'USA'}         -8.3848        2.5339        13.453         0.97912
    {'Sweden' }       {'USA'}         -11.905        1.3672         14.64         0.99953
    {'Italy'  }       {'USA'}          -11.76        6.8672        25.495         0.86579
Load the sample data.
load popcorn
popcorn
popcorn = 6×3
5.5000 4.5000 3.5000
5.5000 4.5000 4.0000
6.0000 4.0000 3.0000
6.5000 5.0000 4.0000
7.0000 5.5000 5.0000
7.0000 5.0000 4.5000
The data is from a study of popcorn brands and popper types (Hogg 1987). The columns of the matrix popcorn are brands (Gourmet, National, and Generic). The rows are popper types oil and air. The first three rows correspond to the oil popper, and the last three rows correspond to the air popper. In the study, researchers popped a batch of each brand three times with each popper. The values are the yield in cups of popped popcorn.
Perform a two-way ANOVA. Also compute the statistics that you need to perform a multiple comparison test on the main effects.
[~,~,stats] = anova2(popcorn,3,"off")stats = struct with fields:
source: 'anova2'
sigmasq: 0.1389
colmeans: [6.2500 4.7500 4]
coln: 6
rowmeans: [4.5000 5.5000]
rown: 9
inter: 1
pval: 0.7462
df: 12
The stats structure includes
The mean squared error (
sigmasq)The estimates of the mean yield for each popcorn brand (
colmeans)The number of observations for each popcorn brand (
coln)The estimate of the mean yield for each popper type (
rowmeans)The number of observations for each popper type (
rown)The number of interactions (
inter)The p-value that shows the significance level of the interaction term (
pval)The error degrees of freedom (
df).
Perform a multiple comparison test to see if the popcorn yield differs between pairs of popcorn brands (columns).
c1 = multcompare(stats);
Note: Your model includes an interaction term.  A test of main effects can be
difficult to interpret when the model includes interactions.
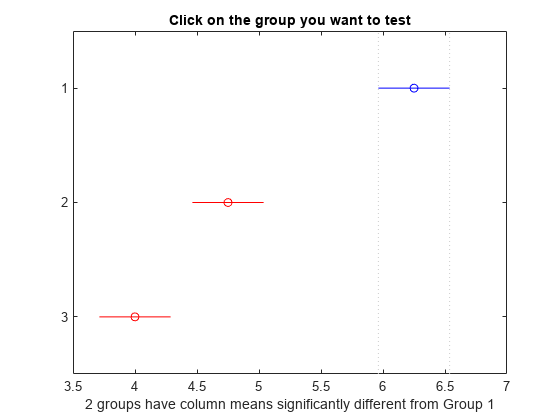
The figure shows the multiple comparisons of the means. By default, the group 1 mean is highlighted and the comparison interval is in blue. Because the comparison intervals for the other two groups do not intersect with the intervals for the group 1 mean, they are highlighted in red. This lack of intersection indicates that both means are different than group 1 mean. Select other group means to confirm that all group means are significantly different from each other.
Display the multiple comparison results in a table.
tbl1 = array2table(c1,"VariableNames", ...
    ["Group A","Group B","Lower Limit","A-B","Upper Limit","P-value"])
tbl1=3×6 table
    Group A    Group B    Lower Limit    A-B     Upper Limit     P-value
    _______    _______    ___________    ____    ___________    __________

       1          2         0.92597       1.5       2.074       4.1188e-05
       1          3           1.676      2.25       2.824       6.1588e-07
       2          3         0.17597      0.75       1.324         0.011591
The first two columns of c1 show the groups that are compared. The fourth column shows the difference between the estimated group means. The third and fifth columns show the lower and upper limits for 95% confidence intervals for the true mean difference. The sixth column contains the p-value for a hypothesis test that the corresponding mean difference is equal to zero. All p-values are very small, which indicates that the popcorn yield differs across all three brands.
Perform a multiple comparison test to see the popcorn yield differs between the two popper types (rows).
c2 = multcompare(stats,"Estimate","row");
Note: Your model includes an interaction term.  A test of main effects can be
difficult to interpret when the model includes interactions.
tbl2 = array2table(c2,"VariableNames", ...
    ["Group A","Group B","Lower Limit","A-B","Upper Limit","P-value"])
tbl2=1×6 table
    Group A    Group B    Lower Limit    A-B    Upper Limit     P-value
    _______    _______    ___________    ___    ___________    __________

       1          2         -1.3828      -1      -0.61722      0.00010037
The small p-value indicates that the popcorn yield differs between the two popper types (air and oil). The figure shows the same results. The disjoint comparison intervals indicate that the group means are significantly different from each other.
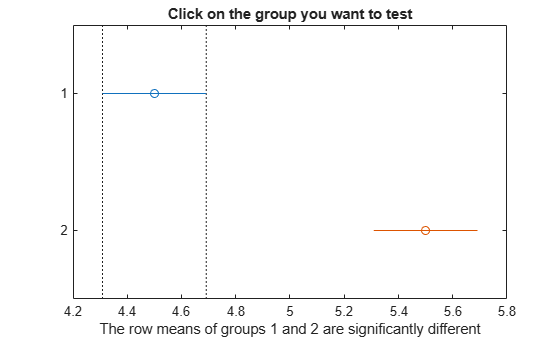
Load the sample data.
y = [52.7 57.5 45.9 44.5 53.0 57.0 45.9 44.0]';
g1 = [1 2 1 2 1 2 1 2];
g2 = ["hi" "hi" "lo" "lo" "hi" "hi" "lo" "lo"];
g3 = ["may" "may" "may" "may" "june" "june" "june" "june"];
y is the response vector and g1, g2, and g3 are the grouping variables (factors). Each factor has two levels, and every observation in y is identified by a combination of factor levels. For example, observation y(1) is associated with level 1 of factor g1, level hi of factor g2, and level may of factor g3. Similarly, observation y(6) is associated with level 2 of factor g1, level hi of factor g2, and level june of factor g3.
Test if the response is the same for all factor levels. Also compute the statistics required for multiple comparison tests.
[~,~,stats] = anovan(y,{g1 g2 g3},"Model","interaction", ...
    "Varnames",["g1","g2","g3"]);
The p-value of 0.2578 indicates that the mean responses for levels may and june of factor g3 are not significantly different. The p-value of 0.0347 indicates that the mean responses for levels 1 and 2 of factor g1 are significantly different. Similarly, the p-value of 0.0048 indicates that the mean responses for levels hi and lo of factor g2 are significantly different.
Perform a multiple comparison test to find out which groups of factors g1 and g2 are significantly different.
[results,~,~,gnames] = multcompare(stats,"Dimension",[1 2]);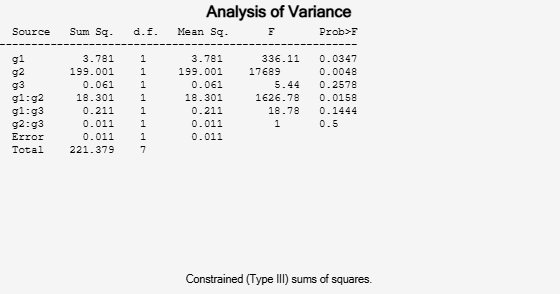
You can test the other groups by clicking on the corresponding comparison interval for the group. The bar you click on turns to blue. The bars for the groups that are significantly different are red. The bars for the groups that are not significantly different are gray. For example, if you click on the comparison interval for the combination of level 1 of g1 and level lo of g2, the comparison interval for the combination of level 2 of g1 and level lo of g2 overlaps, and is therefore gray. Conversely, the other comparison intervals are red, indicating significant difference.
Display the multiple comparison results and the corresponding group names in a table.
tbl = array2table(results,"VariableNames", ...
    ["Group A","Group B","Lower Limit","A-B","Upper Limit","P-value"]);
tbl.("Group A")=gnames(tbl.("Group A"));
tbl.("Group B")=gnames(tbl.("Group B"))
tbl=6×6 table
       Group A           Group B        Lower Limit     A-B     Upper Limit     P-value
    ______________    ______________    ___________    _____    ___________    _________

    {'g1=1,g2=hi'}    {'g1=2,g2=hi'}      -6.8604       -4.4      -1.9396       0.027249
    {'g1=1,g2=hi'}    {'g1=1,g2=lo'}       4.4896       6.95       9.4104       0.016983
    {'g1=1,g2=hi'}    {'g1=2,g2=lo'}       6.1396        8.6        11.06       0.013586
    {'g1=2,g2=hi'}    {'g1=1,g2=lo'}       8.8896      11.35        13.81       0.010114
    {'g1=2,g2=hi'}    {'g1=2,g2=lo'}        10.54         13        15.46      0.0087375
    {'g1=1,g2=lo'}    {'g1=2,g2=lo'}      -0.8104       1.65       4.1104        0.07375
The multcompare function compares the combinations of groups (levels) of the two grouping variables, g1 and g2. For example, the first row of the matrix shows that the combination of level 1 of g1 and level hi of g2 has the same mean response values as the combination of level 2 of g1 and level hi of g2. The p-value corresponding to this test is 0.0272, which indicates that the mean responses are significantly different. You can also see this result in the figure. The blue bar shows the comparison interval for the mean response for the combination of level 1 of g1 and level hi of g2. The red bars are the comparison intervals for the mean response for other group combinations. None of the red bars overlap with the blue bar, which means the mean response for the combination of level 1 of g1 and level hi of g2 is significantly different from the mean response for other group combinations.
Input Arguments
Name-Value Arguments
Output Arguments
More About
References
[1] Hochberg, Y., and A. C. Tamhane. Multiple Comparison Procedures. Hoboken, NJ: John Wiley & Sons, 1987.
[2] Milliken, G. A., and D. E. Johnson. Analysis of Messy Data, Volume I: Designed Experiments. Boca Raton, FL: Chapman & Hall/CRC Press, 1992.
[3] Searle, S. R., F. M. Speed, and G. A. Milliken. “Population marginal means in the linear model: an alternative to least-squares means.” American Statistician. 1980, pp. 216–221.