Main Content

gevpdf

Generalized extreme value probability density function

Description

p = gevpdf(x) returns the probability density function (pdf) of the generalized extreme value (GEV) distribution with a shape parameter equal to 0, scale parameter equal to 1, and location parameter equal to 0, evaluated at the values in x.

p = gevpdf(x,k,sigma,mu) returns the pdf with the shape parameter k, scale parameter sigma, and location parameter mu, evaluated at the values in x.

When k < 0, the GEV distribution is the type III extreme value distribution. When k > 0, the GEV distribution is the type II (Frechet) extreme value distribution. If w has a Weibull distribution, then –w has a type III extreme value distribution and 1/w has a type II extreme value distribution. In the limiting case as k approaches 0, the GEV distribution is the mirror image of the type I (Gumbel) extreme value distribution. For more information, see Generalized Extreme Value Distribution.

The mean of the GEV distribution is not finite when k1, and the variance is not finite when k1/2. The GEV distribution has positive density only for values of x such that k*(x – mu)/sigma > –1. For more information, see Generalized Extreme Value Distribution.

example

Examples

collapse all

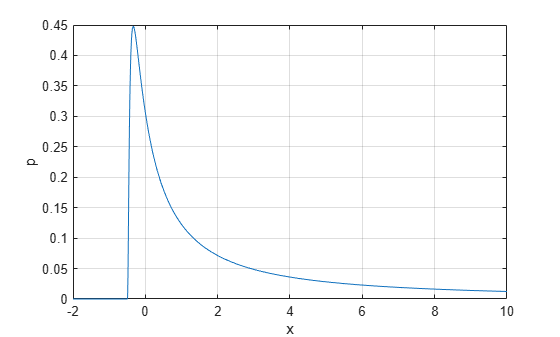
Compute the probability density function (pdf) for a generalized extreme value distribution with the shape parameter k=2, scale parameter sigma=3, and location parameter mu=1, for values in the range –2 to 10.

x = -2:0.01:10;
k = 2;
sigma = 3;
mu = 1;
p = gevpdf(x,k,sigma,mu);

Plot the pdf.

figure;
plot(x,p)
grid on
xlabel("x")
ylabel("p")

Figure contains an axes object. The axes object with xlabel x, ylabel p contains an object of type line.

Input Arguments

collapse all

Values at which to evaluate the generalized extreme value pdf, specified as a scalar value or an array of scalar values.

To evaluate the pdf at multiple values, specify x using an array. To evaluate the pdfs of multiple distributions, specify one or more of the following input arguments using arrays: k, sigma, or mu. If one or more of the input arguments x, k, sigma, and mu are arrays, then the array sizes must be the same. In this case, gevpdf expands each scalar input into a constant array of the same size as the array inputs. Each element in p is the pdf value of the distribution specified by the corresponding elements in k, sigma, and mu, evaluated at the corresponding element in x.

Data Types: single | double

Shape parameter, specified as a scalar value or an array of scalar values.

To evaluate the pdf at multiple values, specify x using an array. To evaluate the pdfs of multiple distributions, specify one or more of the following input arguments using arrays: k, sigma, or mu. If one or more of the input arguments x, k, sigma, and mu are arrays, then the array sizes must be the same. In this case, gevpdf expands each scalar input into a constant array of the same size as the array inputs. Each element in p is the pdf value of the distribution specified by the corresponding elements in k, sigma, and mu, evaluated at the corresponding element in x.

Data Types: single | double

Scale parameter, specified as a positive scalar value or an array of positive scalar values.

To evaluate the pdf at multiple values, specify x using an array. To evaluate the pdfs of multiple distributions, specify one or more of the following input arguments using arrays: k, sigma, or mu. If one or more of the input arguments x, k, sigma, and mu are arrays, then the array sizes must be the same. In this case, gevpdf expands each scalar input into a constant array of the same size as the array inputs. Each element in p is the pdf value of the distribution specified by the corresponding elements in k, sigma, and mu, evaluated at the corresponding element in x.

Data Types: single | double

Location parameter, specified as a scalar value or an array of scalar values.

To evaluate the pdf at multiple values, specify x using an array. To evaluate the pdfs of multiple distributions, specify one or more of the following input arguments using arrays: k, sigma, or mu. If one or more of the input arguments x, k, sigma, and mu are arrays, then the array sizes must be the same. In this case, gevpdf expands each scalar input into a constant array of the same size as the array inputs. Each element in p is the pdf value of the distribution specified by the corresponding elements in k, sigma, and mu, evaluated at the corresponding element in x.

Data Types: single | double

Output Arguments

collapse all

Generalized extreme value pdf values, returned as a numeric scalar or array. p is the same size as x, k, sigma, and mu after any necessary scalar expansion. Each element in p is the pdf value of the distribution specified by the corresponding elements in k, sigma, and mu, evaluated at the corresponding element in x.

Alternative Functionality

  • gevpdf is a function specific to the GEV distribution. Statistics and Machine Learning Toolbox™ also offers the generic function pdf, which supports various probability distributions. To use pdf, create a GeneralizedExtremeValueDistribution probability distribution object and pass the object as an input argument or specify the probability distribution name and its parameters. Note that the distribution-specific function gevpdf is faster than the generic function cdf.

  • Use the Probability Distribution Function Tool to create an interactive plot of the cumulative distribution function (cdf) or probability density function (pdf) for a probability distribution.

References

[1] Embrechts, P., C. Klüppelberg, and T. Mikosch. Modelling Extremal Events for Insurance and Finance. New York: Springer, 1997.

[2] Kotz, S., and S. Nadarajah. Extreme Value Distributions: Theory and Applications. London: Imperial College Press, 2000.

Extended Capabilities

expand all

C/C++ Code Generation
Generate C and C++ code using MATLAB® Coder™.

Version History

Introduced before R2006a