Gage R&R Analyzer
R2026bDescription
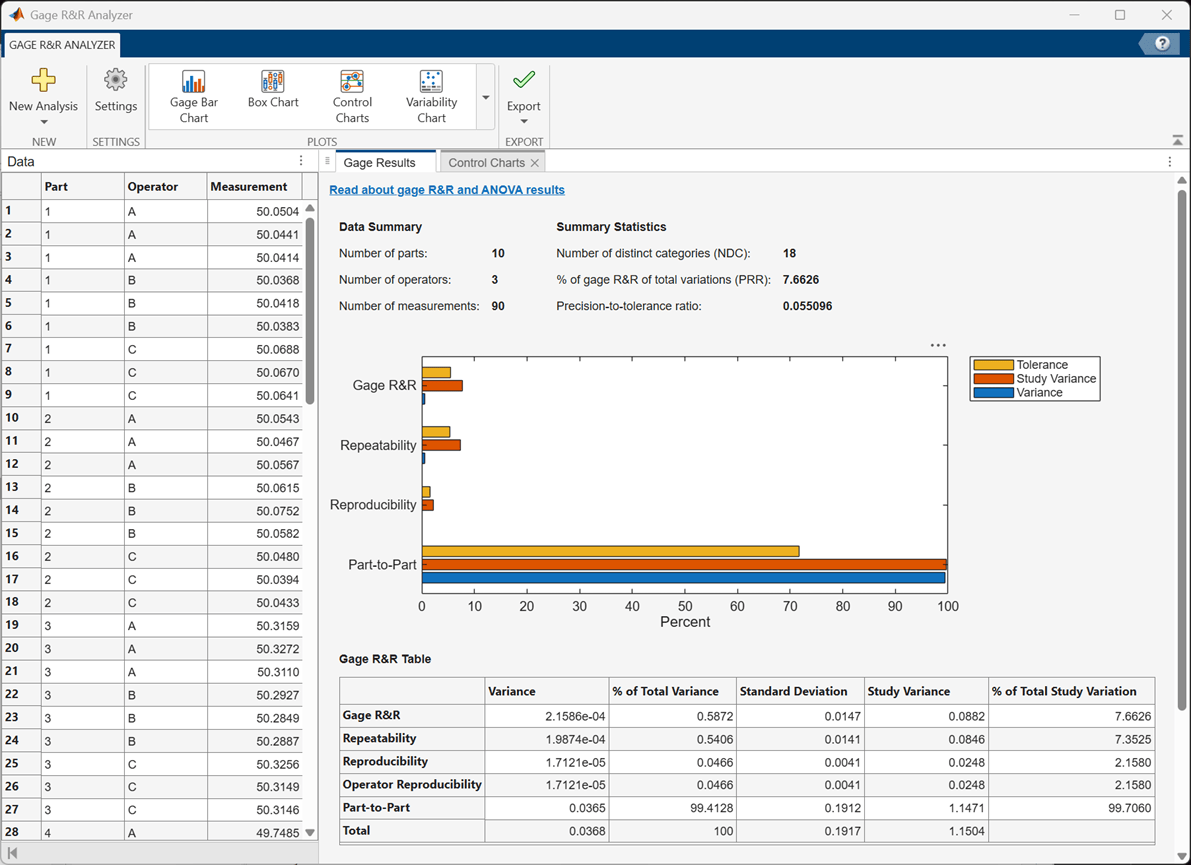
Use the Gage R&R Analyzer app to perform an interactive gage repeatability and reproducibility (R&R) study on a set of parts measurements made by different operators. After you import your measurement data from the workspace or a file into the app, you can set options such as the process specification limits, standard deviation multiplier, and ANOVA model type. The app performs an R&R study automatically, and creates a bar chart and tables summarizing the gage R&R and ANOVA model results. You can export the results to the MATLAB® workspace for further analysis.
The app provides several charts to help you visualize your measurement data and the R&R study results:
Gage bar chart — Plot the relative contribution of different sources to the total measurement variance.
Box chart — Display box charts of the measurement data and median values, grouped by part and operator.
Variability chart — Display the individual measurements and their mean values for each operator and part.
Control charts — Display Shewhart X-bar, R, and S control charts that show the measurements, specification limits, and out-of-control values.
For a workflow example, see Perform Interactive Gage Repeatability and Reproducibility Study.
Open the Gage R&R Analyzer App
MATLAB Toolstrip: On the Apps tab, under Math, Statistics and Optimization, click the app icon.
MATLAB command prompt: Enter
gageRRAnalyzer.
Examples
In a gage repeatability and reproducibility (R&R) study, multiple operators use gages to obtain repeated measurements of a set of items (parts) under the same conditions, if possible. If a system has high precision, the measurements of an individual part are narrowly scattered around a single value.
This example shows how to use the Gage R&R Analyzer app to perform an interactive gage R&R study on a simulated data set obtained by three operators (A, B, and C) on 10 parts labeled 1 through 10. Each operator measured each part three times, in random order.
Load Data Set Into Workspace
In the MATLAB® Command Window, load the data set that contains the measurements for the simulated parts.
load gageRRdata1.matNote: If you click the button located in the upper-right section of this example and open this example in MATLAB, then MATLAB opens the example folder. This folder includes the data set file. Alternatively, you can enter openExample("gageRRdata1.mat") at the command line.
Launch App and Perform Analysis
At the MATLAB command prompt, enter gageRRAnalyzer to launch the app.
In the app toolstrip, click New Analysis and select From Workspace Data.
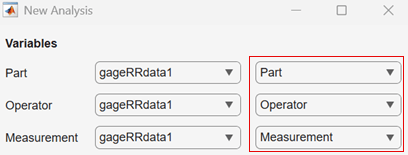
In the New Analysis dialog box, select the gageRRdata1 table variable from the Part menu in the first column under Variables. The app fills in the same variable name for the Operator and Measurement selections in the first column.
In the second column, select the Part, Operator, and Measurement table variables.
Set the specification limits for the analysis. In the Lower Specification Limit box, enter 49.2, and in the Lower Specification Limit box, enter 50.8.
The default standard deviation multiplier value is 6, which corresponds to a six-sigma analysis. Use the default Linear ANOVA model type. Ensure that Random Operator is selected, which is an appropriate setting for this data set, because operators are not assigned to a specified part.
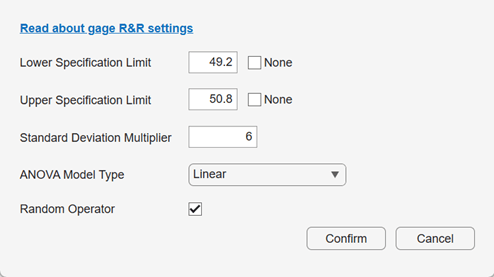
Click Confirm to perform the gage R&R analysis.
View Analysis Results
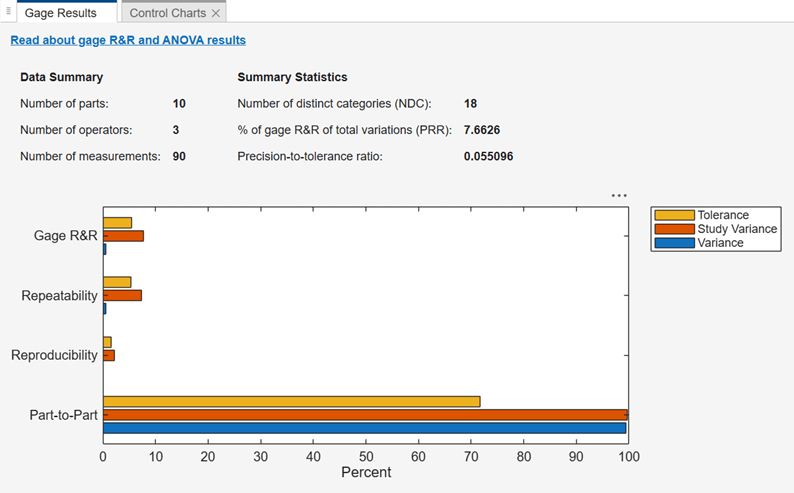
The app displays the analysis results in the Gage Results tab.
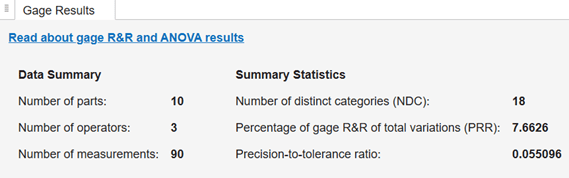
In the Summary Statistics section, the computed values all indicate a capable system. Specifically, the number of distinct categories value is greater than 5, the percentage of gage R&R of total variations value is less than 10%, and the precision-to-tolerance ratio is less than 0.1.
The tab also contains a gage bar chart showing the sources of variability, and a gage R&R summary table. 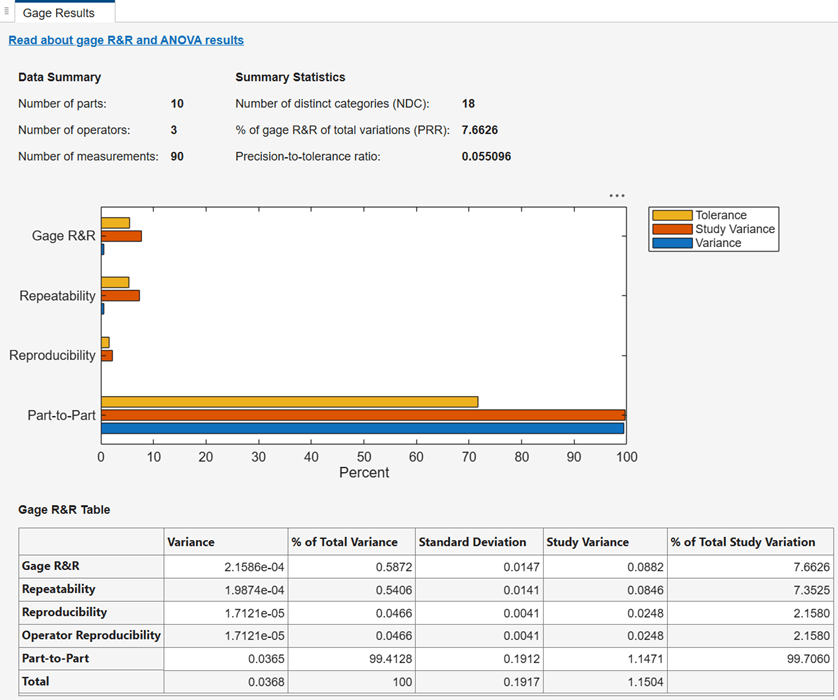
The chart and table indicate that 99.4% of the variability is due to part-to-part variance. The repeatability percentage (0.54%) represents the contribution from variations in the measurements of the same part, collected by the same operator. The contribution from variations in the measurements collected by the same operator (Operator Reproducibility) is negligible (0.05%).
The ANOVA results table contains the analysis-of-variance results. For more information about the entries in the ANOVA results table, see anovan.

Visualize Data Using Box Chart and Variability Plots
In the Plots section of the toolstrip, click Box Chart. In the Box Chart Options panel at the right of the plot, select Grouped by part for Type, and select Show median comparison.
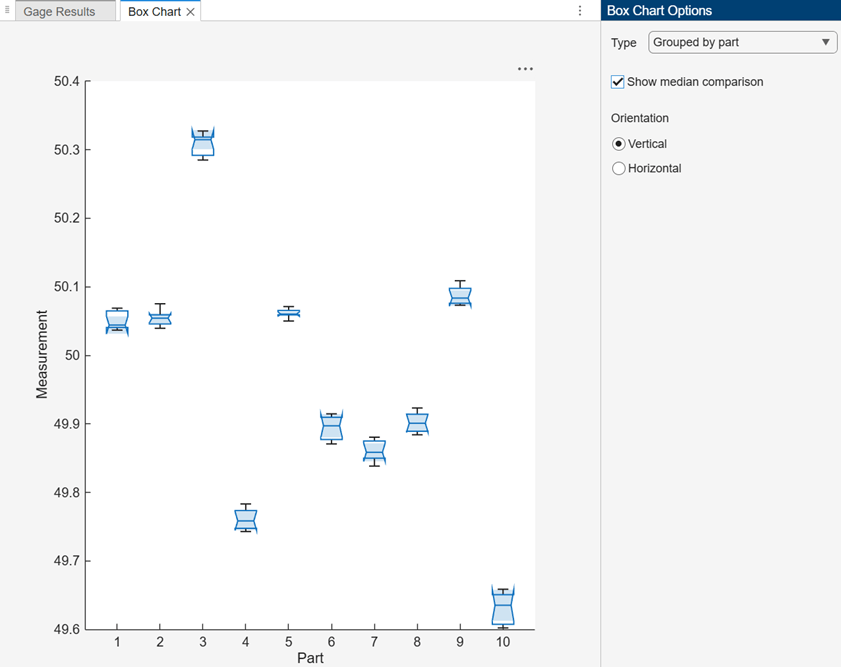
The plot contains a box chart for each part. The median value is indicated by the horizontal line inside each box chart. Box charts whose notches do not overlap have different medians at the 5% significance level. The plot indicates that many parts have significantly different medians, which is consistent with the conclusion that part-to-part variations are the largest source of variance in this system.
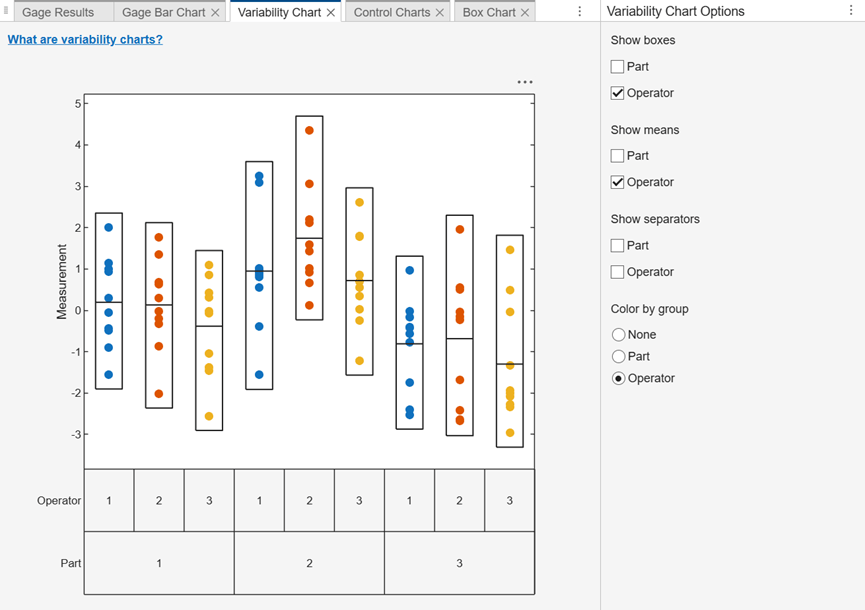
In the Plots section of the toolstrip, click Variability Chart. In the Variability Chart Options panel at the right of the plot, select Operator in the Show boxes, Show means, and Color by group sections. The plot displays the measurements ordered by part and grouped by operator. 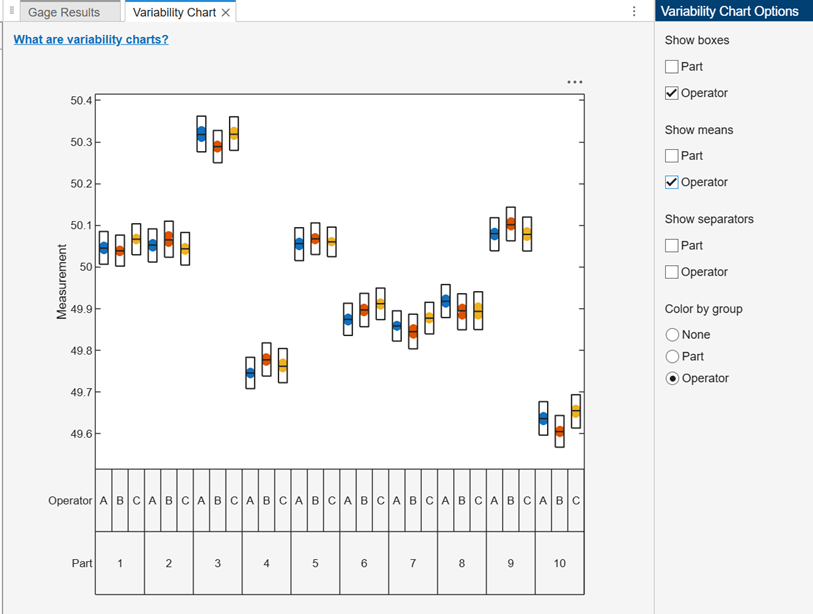
The plot indicates that the operators tend to obtain the same mean measurement for each part.
Create Shewart Control Charts
In the Plots section of the toolstrip, click Control Charts. In the Control Chart Options panel at the right of the plot, select Part for X-Axis and clear the R and S check boxes to show only an X-bar chart.
To set the control limits for this system, select Use custom limits and enter 49.8 and 50.2 in the Lower and Upper boxes, respectively.
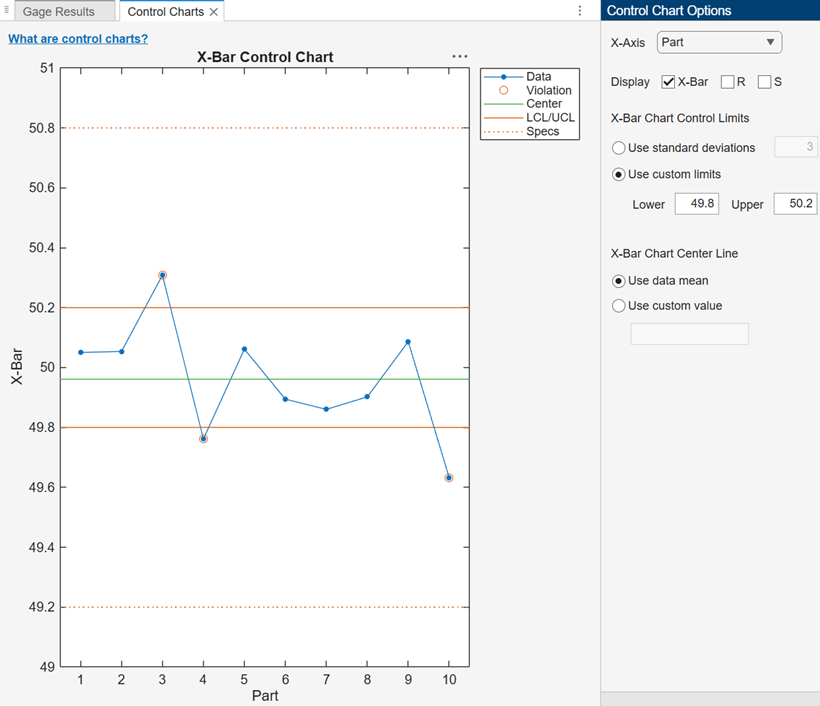
The plot indicates that parts 3, 4, and 10 are outside the control limits.
To display an S chart, select S and clear the X-Bar check box in the Control Chart Options panel. To group the data into Operator subgroups, select Operator for X-Axis. Select Use standard deviations to use three sigma control limits.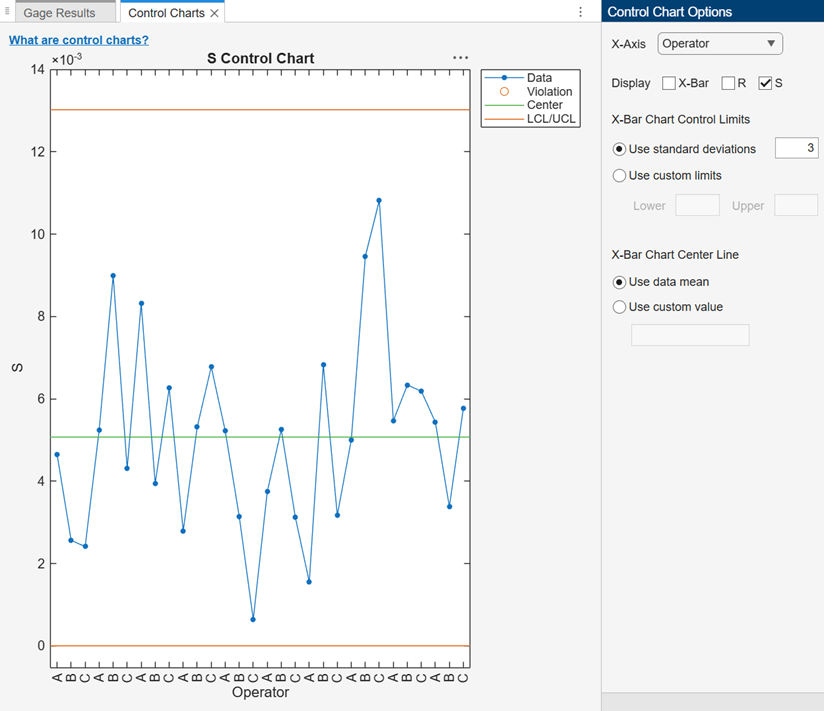
The app creates the subgroups by grouping consecutive measurements made by the same operator. In this data set, the measurements are sorted by part and then operator, so each subgroup in the S chart contains the measurements of a part by a single operator. The plotted values are the standard deviation for each subgroup. None of the subgroups are outside the control limits, which indicates consistency in the measurements of each part by each operator.
Export Gage R&R Analysis Results
To export the gage R&R analysis results to a workspace structure variable, click Export in the Export section of the toolstrip, and select Export Results. In the Export Results dialog box, modify the workspace variable name, if necessary, and click Confirm. 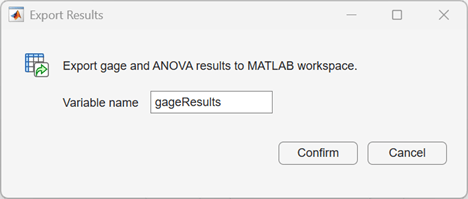
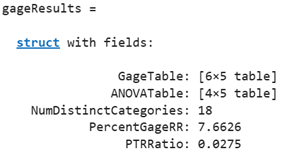
Display the contents of the workspace variable.
display(gageResults)
Parameters
Variables
Parts, specified as a workspace variable. The variable must be a categorical, character, or string array; or a logical or numeric column vector; or a cell array of character vectors; or a table. When you select a table or import data from a file, you must select a variable from the rightmost list in the New Analysis dialog box. Each element of Part contains an identifier for the part associated with the corresponding Measurement value.
Operators, specified as a workspace variable. The variable must be a categorical, character, or string array; or a logical or numeric column vector; or a cell array of character vectors; or a table. When you select a table or import data from a file, you must select a variable from the rightmost list in the New Analysis dialog box. Each element of Operator contains an identifier for the operator associated with the corresponding Measurement value.
Settings
To set a lower specification limit, clear the associated None
check box and enter a numeric scalar value. If you set an upper specification limit and
do not set a lower specification limit, the app sets the lower specification limit to
-Inf. If you do not set a lower or upper specification limit, the
app does not compute a precision-to-tolerance ratio (PTR) value. For more information
about PTR, see Gage R&R
Study.
To set an upper specification limit, clear the associated None
check box and enter a numeric scalar value. If you set a lower specification limit and
do not set an upper specification limit, the app sets the upper specification limit to
Inf. If you do not set a lower or upper specification limit, the
app does not compute a PTR value. For more information about PTR, see Gage R&R
Study.
Standard deviation multiplier, specified as a positive scalar. The app uses this value to calculate the study variation and the precision-to-tolerance ratio. For more information, see Gage R&R Study.
Select one of the following ANOVA model types.
| Value | Description |
|---|---|
Linear (default) | Main effects only |
Interactions | Main effects plus two-factor interactions between operators and parts |
Operator Nested in Part | Use this model when operators are assigned to specific parts, and the operators measure only those specific parts. |
Part Nested in Operator | Use this model when each part is measured by a specific operator only. |
For more information about ANOVA model types, see anovan.
Select Random Operator (the default) if operators are randomly assigned to each part. If you clear the check box, the app uses a mixed-effects model, where the parts variable is a random effect and the operators variable is a fixed effect.
Box Chart Options
Select one of the following grouping types for the box chart plot:
Grouped by part and operator— The plot contains box charts for each operator, and the operators are grouped by part.Grouped by part— The plot contains a box chart for each part.Grouped by operator— The plot contains a box chart for each operator.All— The app displays all of the above plot types.
For more information about box charts, see boxchart.
Select Show median comparison to display a tapered, shaded
region around the median of each box chart. The median value is indicated by the
horizontal line inside each box chart. Box charts whose notches do not overlap have
different medians at the 5% significance level. The significance level is based on a
normal distribution assumption, but the median comparison is reasonably robust for other
distributions. For more information, see boxchart.
Control Chart Options
Select one of the following grouping methods for the control charts:
Part and operator— The app groups consecutive measurements with the same part and operator values into subgroups.Part— The app groups consecutive measurements with the same part value into subgroups.Operator— The app groups consecutive measurements with the same operator value into subgroups.
Each plot marker in the control charts corresponds to a subgroup. Subgroups can have different numbers of measurements.
Select one or more of the following Shewhart control chart types to display:
X-Bar — Plot of the arithmetic mean of the measurements in each subgroup. If you do not specify a custom center line value (see
Center Line), the green line indicates the mean of all measurements.R — Plot of the largest absolute difference between any two measurements within each subgroup. The green center line value of each subgroup is proportional to the average within-subgroup standard deviation and the number of measurements in the subgroup.
S — Plot of the standard deviation of the measurements in each subgroup. The green center line indicates the mean of the subgroup standard deviation values.
The app circles the marker of any subgroup that lies outside the control
limits. The lower control limit (LCL) and upper control limit (UCL) are indicated with
red lines. The lower and upper specification limits are indicated with dotted orange
lines. For more information about control charts, see controlchart.
To specify the control limits, select Use standard deviations (the default) and adjust the standard deviation multiplier value, if necessary. The control limits for each subgroup are equal to mu ± k*se, where mu is the center line value, k is the standard deviation multiplier value, and se is the standard deviation of the subgroup divided by the square root of the number of measurements in the subgroup.
Alternatively, you can select Use custom limits and enter numeric values in the Lower and Upper boxes.
Specify the (green) center line value to display in the X-bar chart. Select Use data mean to use the mean value of all the measurements (the default), or select Use custom value and enter a center line value.
Variability Chart
In the Plots section of the toolstrip, click Variability Chart to display a plot of the measurement values grouped by operator and part. Select options in the Variability Chart Options section to the right of the plot to show boxes around each part and operator, and to color the plot markers by part or operator. You can also add vertical separator lines between the parts and operators, and mean lines to the plot. Select Part under Show means to add a horizontal line indicating the mean measurement value for each part. Select Operator to show the mean value measured by each operator on each part.
More About
A gage repeatability and reproducibility (R&R) study uses one- or two-way analysis
of variance (see anovan) to assess the precision of a measurement
system. In a typical system, multiple operators use gages to obtain repeated measurements of
a set of items (parts) under the same conditions, if possible. If a system has high
precision, the measurements of an individual part are narrowly scattered around a single
value. There are several possible sources of variability in a measurement system.
| Variability Source | Description |
|---|---|
| Repeatability | Variation in the measurements of the same part, collected by the same operator |
| Operator Reproducibility | Variation in the measurements collected by the same operator |
| Part*Operator Reproducibility | Variation in the measurements due to the interactions of parts and operators |
| Reproducibility | Sum of Operator reproducibility and Part*Operator reproducibility |
| Gage R&R | Total measurement variation due to repeatability and reproducibility |
| Part-to-Part | Variation among the set of parts. |
The total variability in a measurement system is the sum of gage R&R variability and part-to-part variability.
Each of the variability sources can be characterized by a statistical metric. Common
metrics are the variance, standard deviation (square root of the variance), percentage of
the total variance, and percentage of the total standard deviation. The study
variation is a measure of all variability in the measurement system due to
repeatability and reproducibility, and is defined as the Standard Deviation
Multiplier value times the gage R&R standard deviation. The default
multiplier value is 6.
The app displays three common summary metrics that describe the capability of a measurement system to distinguish the parts from each other, based on the measurement data:
The number of distinct categories (NDC) is a measure of how many groups the system can distinguish within the measurement data. NDC is equal to times the ratio of part-to-part standard deviation to gage R&R standard deviation. An NDC value of 5 or larger is indicative of a capable measurement system. A system with an NDC value smaller than 2 is not capable. For example, if a measurement system has NDC=3, the measurements can be divided into three groups, such as low, middle, and high.
The percentage of gage R&R of total variations (PRR) is the fraction of the total standard deviation that is due to gage R&R variability. In general, a system with PRR less than 10% is capable, while a PRR value greater than 30% indicates that the system is not capable.
If you set Lower Specification Limit and Upper Specification Limit values, the app computes the precision-to-tolerance ratio (PTR). The PTR is equal to the Standard Deviation Multiplier value times the gage R&R standard deviation, divided by the tolerance. The tolerance is the upper specification limit minus the lower specification limit. In general, a system with PTR less than 0.1 is capable, while a PTR value greater than 0.3 indicates that the system is not capable. For example, if the lower and upper specification limits for the set of parts are 1 and 20, respectively, and the standard deviation of the measurements due to gage R&R is 0.3, the PTR value is 0.08, indicating a capable system.
The app displays a gage bar chart on the Gage Results tab, which shows the percentage of total study variation (red bars) and the percentage of total variance (blue bars) for the following variability sources: gage R&R, repeatability, reproducibility, and part-to-part. If you set lower and upper specification limits, the plot also contains yellow bars for the percentage of tolerance. You can also display a vertical gage bar chart by clicking Gage Bar Chart in the Plots section of the toolstrip.
The app displays the ANOVA results in a table at the bottom of the Gage
Results tab. To specify the ANOVA model type, click
Settings in the toolstrip and select an ANOVA Model Type
setting. The app uses Type III sum of squares. For more information about the ANOVA results
table, see anovan.
Version History
Introduced in R2026b

