Specify Temperature on SPICE Diode Block with Environment Parameters Block
This example shows how to use the Environment Parameters block to change the temperature of a SPICE Diode block in a simple circuit.
Semiconductors are nonlinear components whose operation depends on the environment parameters. When you connect the Environment Parameters block to an electrical network, the block controls the SPICE temperature and minimum conductance of all SPICE-compatible blocks inside the network.
Not all SPICE environment parameters have a direct equivalent in Simscape™ Electrical™. Some SPICE environment parameters are directly related to Simulink Solver parameters or Solver Configuration block parameters.
SPICE Diode Characterization
In this example, you simulate the behavior of a SPICE Diode block for different DC input voltage and compare the results with technical specifications of the 1N4448HLP switch diode [1].
This equation shows how different temperatures affect the geometry-adjusted saturation current of a SPICE diode:
,
where:
is the geometry-adjusted saturation current.
is the diode temperature.
is the parameter extraction temperature.
is the saturation current temperature exponent.
is the emission coefficient.
is the activation energy.
is thermal voltage.
Model Overview
Open the ee_environment_parameters_characterize_diode.slx model.
model = 'ee_environment_parameters_characterize_diode';
open_system(model);
This model contains these components:
PS-Ramp block that specifies the input voltage, , in the range
Controlled DC Voltage Source block
Environment Parameters block to specify the temperature of the SPICE components
Current Sensor block to measure the current
Scope block to display the current of the circuit
Electrical Reference block
Solver Configuration block
Simulate Model and Characterize Diode
Set the temperature to by modifying the Temperature parameter of the Environment Parameters block. Simulate the model and get the results for the diode current and voltage.
set_param([model,'/Environment Parameters'],'Temperature_unit','degC');
set_param([model,'/Environment Parameters'],'Temperature',num2str(25));
resultsAt25DegC = sim(model);

diodeVoltageAt25DegC  = resultsAt25DegC.simlog_ee_environment_parameters_characterize_diode.SPICE_Diode.p.v.series.values - ...
    resultsAt25DegC.simlog_ee_environment_parameters_characterize_diode.SPICE_Diode.n.v.series.values;
diodeCurrentAt25DegC = resultsAt25DegC.simlog_ee_environment_parameters_characterize_diode.SPICE_Diode.diocur.i.series.values;
Now set the temperature to and simulate the model again.
set_param([model,'/Environment Parameters'],'Temperature',num2str(150));
resultsAt150DegC = sim(model);
diodeVoltageAt150DegC = resultsAt150DegC.simlog_ee_environment_parameters_characterize_diode.SPICE_Diode.p.v.series.values - ...
    resultsAt25DegC.simlog_ee_environment_parameters_characterize_diode.SPICE_Diode.n.v.series.values;
diodeCurrentAt150DegC = resultsAt150DegC.simlog_ee_environment_parameters_characterize_diode.SPICE_Diode.diocur.i.series.values;
You can characterize the operation of a diode by using the correspondence between the reverse current and the reverse voltage response , as well as the relationship between the forward current and the forward voltage response , at different temperatures.
Plot Reverse Voltage and Current
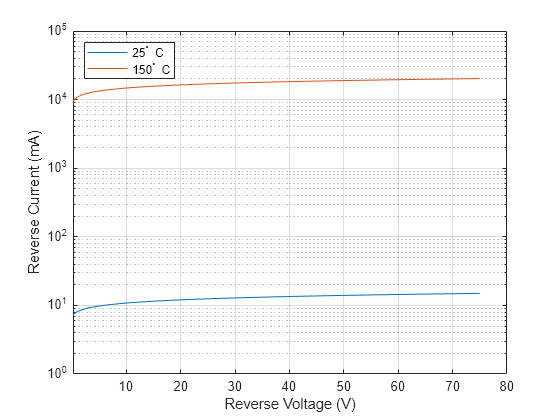
Plot the reverse current as a function of the reverse voltage using a semi-logarithmic scale. When the diode temperature increases, the diode conductance also increases and so the reverse current increases. This behavior agrees with the technical specifications. The reverse current also increases when the reverse voltage increases because a higher voltage implies a higher charge in the capacitance of the diode.
idxReverseVoltageAt25DegC = diodeVoltageAt25DegC <0;
reverseVoltageAt25DegC = abs(diodeVoltageAt25DegC(idxReverseVoltageAt25DegC));
reverseCurrentAt25DegC = abs(diodeCurrentAt25DegC(idxReverseVoltageAt25DegC)).*1e9;

idxReverseVoltageAt150DegC = diodeVoltageAt150DegC<0;
reverseVoltageAt150DegC = abs(diodeVoltageAt150DegC(idxReverseVoltageAt150DegC));
reverseCurrentAt150DegC = abs(diodeCurrentAt150DegC(idxReverseVoltageAt150DegC)).*1e9;

figure
semilogy(reverseVoltageAt25DegC,reverseCurrentAt25DegC);
hold on
semilogy(reverseVoltageAt150DegC,reverseCurrentAt150DegC);
legend("25^\circ C","150^\circ C",Location="northwest")
ylabel("Reverse Current (mA)")
xlabel("Reverse Voltage (V)")
grid on
xlim([0.2 80])

This figure shows the specification diagram for the instantaneous reverse current and the instantaneous reverse voltage. The simulation results are on the same order of magnitude as the technical specifications [2].
Plot Forward Current and Voltage
To conduct electricity, each diode has a minimum potential threshold. The potential threshold or knee voltage is the minimum voltage required to overcome the activation energy of the semiconductor. For an Si diode, the activation energy is given by this equation:
.
The typical value of the potential threshold that corresponds to is given by this equation:
.
When the temperature increases, the kinetic energy of the molecules in the semiconductor also increases. A higher kinetic energy means a lower potential threshold value.
Because you can change the temperature of the device using the Environment Parameters block, you can use the model to examine the - response of the circuit.
Plot the forward current and forward voltage of the diode on a linear scale using the ee_environment_parameters_plot_forward function. This function takes these inputs:
The voltage and current from the simulation at
The voltage and current from the simulation at
The label at
The label at
The scale to use for plotting, which you can specify as
"linear"or"semilog"
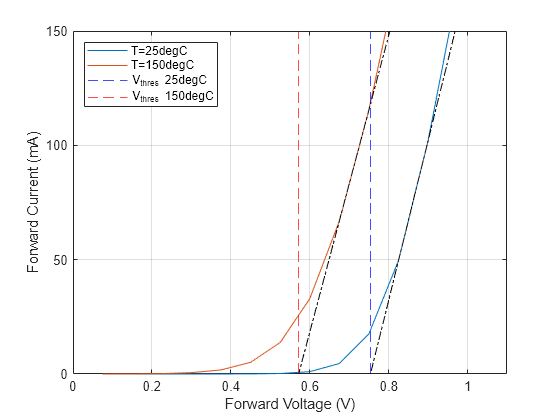
ee_environment_parameters_plot_forward([diodeVoltageAt25DegC,diodeCurrentAt25DegC],...
    [diodeVoltageAt150DegC,diodeCurrentAt150DegC],...
    '25degC','150degC','linear');

To estimate the threshold potential for each temperature, find the intersection of the tangent in the - response with the forward voltage axis:
(blue dashed line)
(red dashed line)
As expected, when the temperature increases, the potential threshold decreases.
Now compare the simulation at with the technical specification [2]. In this table, corresponds to the threshold potential for different testing currents, , at .
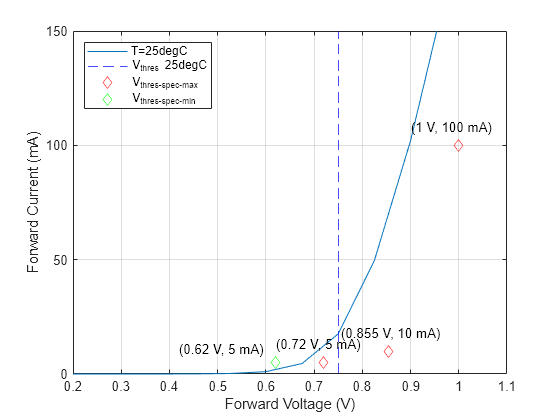
maxDiodeThresholdPotentialSpecs = [0.72 0.855 1];
testCurrentForThresholdPotential = [5 10 100];

idxForwardVoltageAt25degC = diodeVoltageAt25DegC >0;
forwardVoltageAt25degC = diodeVoltageAt25DegC(idxForwardVoltageAt25degC);
forwardCurrentAt25degC = diodeCurrentAt25DegC(idxForwardVoltageAt25degC)*1e3;

figure
plot(forwardVoltageAt25degC,forwardCurrentAt25degC)
hold on
xline(0.75, 'b--')
scatter(maxDiodeThresholdPotentialSpecs,testCurrentForThresholdPotential, ...
    Marker="diamond",MarkerEdgeColor="r")

for k=1:numel(maxDiodeThresholdPotentialSpecs)
      text(maxDiodeThresholdPotentialSpecs(k)-0.1,testCurrentForThresholdPotential(k)+8,...
          [ '(',num2str(maxDiodeThresholdPotentialSpecs(k)) ' V, ' num2str(testCurrentForThresholdPotential(k)) ' mA)'])
end

ylabel("Forward Current (mA)")
xlabel("Forward Voltage (V)")
grid on
xlim([0.2 1.1])
ylim([0 150])
scatter(0.62, 5,Marker="diamond", MarkerEdgeColor="g")
text(0.62-0.2,5+6,[ '(', num2str(0.62) ' V, ' num2str(5) ' mA)'])
legend('T=25degC', 'V_{thres} 25degC', 'V_{thres-spec-max}','V_{thres-spec-min}' , Location='northwest')
As expected, the threshold potential, , from the simulation results at is lower than the maximum threshold potential and higher than the minimum from the technical specifications.
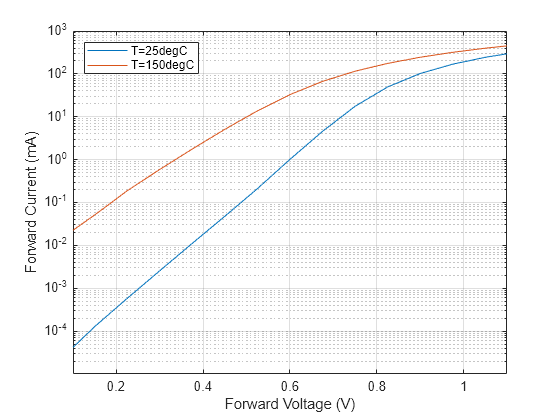
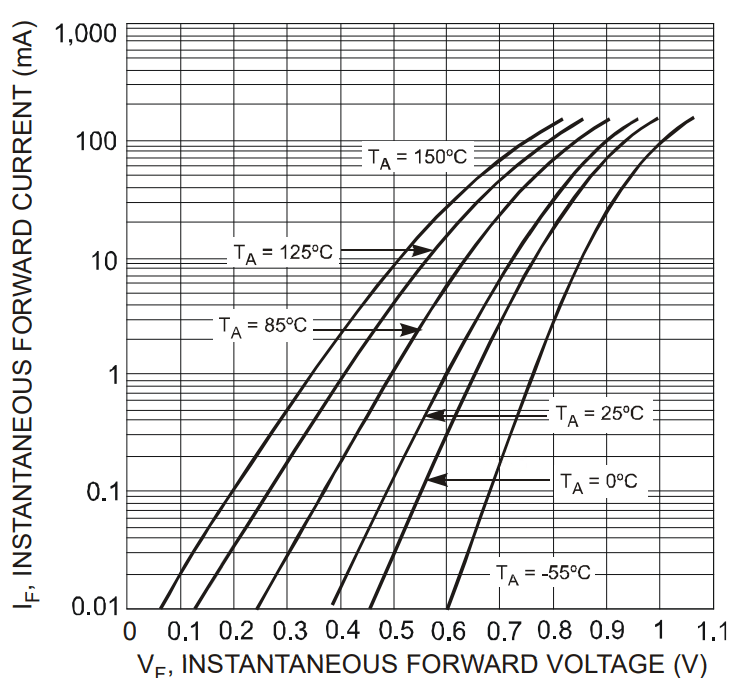
Plot the forward current as a function of the forward voltage using a semilogarithmic scale.
ee_environment_parameters_plot_forward([diodeVoltageAt25DegC,diodeCurrentAt25DegC],...
    [diodeVoltageAt150DegC,diodeCurrentAt150DegC],'25degC','150degC','semilog');

Now compare this plot with the technical specification diagram of the - response for low instantaneous voltage. The simulation results are on the same order of magnitude as the technical specifications [2].
References
[1] Diodes Incorporated. "Switching Diode Models." Diodes Zetex Semiconductors Ltd. https://www.diodes.com/assets/Spice-Models/Discrete-Prodcut-Groups/Switching-Diodes.txt.
[2] Diodes Incorporated. "1N4448HLP. Surface Mount Fast Switching Diode." 2019. https://www.diodes.com/assets/Datasheets/ds30590.pdf.