Execution Time Measurement and Block Profiling
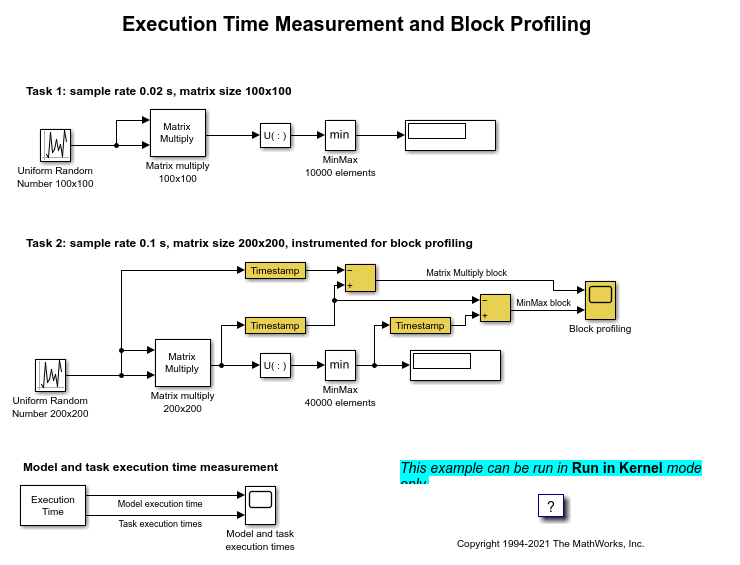
This example shows how to analyze model execution performance in Simulink® Desktop Real-Time™. The example is a multirate multi-tasking model that performs a time-intensive operation of matrix multiplication and finding the minimum in the resulting matrix product. This is being done for two different matrix sizes at two different sample rates.
The task-level performance information is returned by the Execution Time block. The first output port shows the total time of execution of each base rate step of the entire model. The second output port shows time of execution of each task.
To further refine the performance analysis, one of the two tasks is instrumented to obtain block-level information. The added Timestamp blocks capture the timestamps of input and output signals of blocks that are to be investigated. By subtracting the timestamps for input and output signals, execution times of the blocks are obtained.
Note: This example must be run in Run in Kernel Mode and requires Simulink Coder™.
To switch to Run in Kernel mode, on the Desktop Real-Time tab, select Mode > Run in Kernel.
To start the real-time execution, click Run in Real Time.
The model builds, connects to Simulink in Run in Kernel mode, and starts.
Open the Model
open_system('sldrtex_profiling');

Close Open Scopes
close_system(find_system(gcs ,'BlockType', 'Scope'));
Clean Up Model
clear
close all
bdclose('sldrtex_profiling')