View Model Testing Status in Simulink Test Manager
With Simulink® Check™ and Simulink Test™, you can monitor the progress and quality of your model testing efforts directly from the Dashboard tab in Simulink Test Manager. The dashboard analyzes the models, tests, and test results in your project to determine the current state of your model testing activities. From the dashboard, you can access detailed metric results, including the status of testing and aggregated coverage for each model in your project. The metrics in the dashboard measure different aspects of model testing completeness and quality based on industry-recognized standards such as ISO 26262 and DO-178.

Collect and Inspect Metric Results
Load a project that contains your model testing artifacts. The dashboard uses the project information and structure to identify and analyze the artifacts that are relevant to your design. The project folder determines which artifacts the dashboard metrics analyze.
If you do not have a project, you can create a project directly from your current model or folder. For information, see Create Project. You can, optionally, modify your project settings to reconfigure what you see in the dashboard. For general information on how to customize and use projects, see Create Project to Use Model Design and Model Testing Dashboards.
Open Simulink Test Manager. For information, see Simulink Test Manager (Simulink Test).
Open the dashboard. In Simulink Test Manager, click the Dashboard tab. By default, the Dashboard tab appears next to the Start Page tab in Simulink Test Manager.

If the dashboard has not analyzed the project before, the dashboard shows the Start Project Analysis dialog box. In the Start Project Analysis dialog box, click Start to analyze your project.
The first time that you open the dashboard on your project, the dashboard needs to perform an initial analysis of your project. The initial analysis allows the dashboard to identify each of the artifacts in the project, its inner structure, and the traceability relationships between artifacts.
If the artifact tracing setting is not enabled for the project, the dashboard shows the Enable Artifact Tracing dialog box. The dashboard needs to monitor the artifacts in your project to identify outdated metric results. In the Enable Artifact Tracing dialog box, click Enable and Continue to allow the dashboard to monitor artifacts. The dashboard stores this setting in the meta information of the project. For information on how the dashboard monitors and analyzes artifacts, see Monitor Artifact Traceability and Detect Outdated Results with Digital Thread.
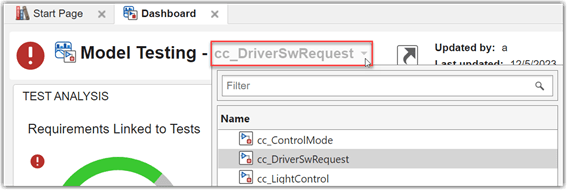
Select the model that you want to collect and view metric results for from the model list at the top of the dashboard.

If you previously collected metric results for a model, the dashboard populates with the existing data. Otherwise, the dashboard shows a warning banner indicating that no metric results are available.
On the warning banner, click Collect to collect metric results for the model. Collecting results for a metric requires a license for the product that supports the underlying artifacts, such as Requirements Toolbox™, Simulink Test, or Simulink Coverage™. After you collect metric results, you only need a Simulink Check license to view the results. For more information, see Model Testing Metrics.
Inspect the metric results. The dashboard widgets summarize the metric results and show testing issues that you can address, such as:
Missing traceability between requirements and tests
Tests or requirements with a disproportionate number of links between requirements and tests
Failed or disabled tests
Missing model coverage
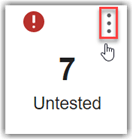
To view information about the metric results in a widget, point to the widget, point to the three dots in the top-right corner of the widget, and click the Help icon.

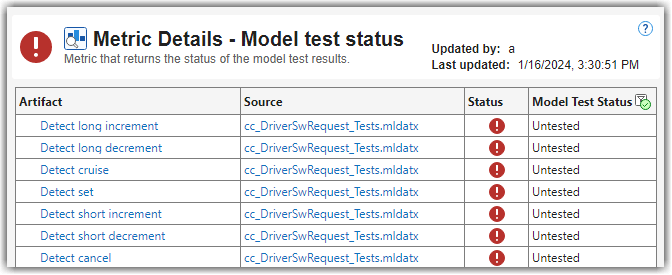
You can view detailed metric results from the Model Testing Dashboard app by clicking a widget in the dashboard. For example, in the Model Test Status section of the dashboard, click the Untested widget. The dashboard opens the Metric Details for the widget with a table of metric values and hyperlinks to each related artifact. The table shows the model unit tests that are currently untested and the associated test file. If you point to a hyperlink, you can see a tooltip with detailed information about the artifact. As you run tests in Simulink Test Manager, the dashboard consolidates the data from across your test results to automatically determine the overall model test status and aggregated model coverage. For more information, see Explore Status and Quality of Testing Activities Using Model Testing Dashboard.

Open Model Testing Dashboard
Alternatively, you can directly open the Model Testing Dashboard app by clicking the Open in Dashboard App button at the top of the Dashboard tab.

For information about the dashboard app, see Explore Status and Quality of Testing Activities Using Model Testing Dashboard.
See Also
Model Testing Dashboard | Simulink Test Manager (Simulink Test)