Explore the Dependency Graph, Views, and Filters
If you have not yet run an analysis, on the Project tab, click the down arrow to expand the Tools gallery. Under Apps, click Dependency Analyzer.
The dependency graph displays your project structure, dependencies, and how files relate to each other. Each item in the graph represents a file and each arrow represents a dependency. For more details, see Investigate Dependency Between Two Files.
By default, the dependency graph shows all files required by your project. To help you investigate dependencies or a specific problem, you can simplify the graph using one of the following filters:
Use the Views to color the files in the graph by type, class, source control status, and label. See Color Files by Type, Status, or Label.
Use the check boxes in the Legend pane to filter out a group of files.
Use the Impact Analysis tools to simplify the graph. See Find Dependencies of Selected Files.
Select, Pan, and Zoom
To select an item in the graph, click it.
To select multiple files, press Shift and click the files.
To select all files of a certain type, hover the pointer over the corresponding item in the Legend pane and click the Add to selection icon.
To clear all selection, click the graph background.
To remove all files of a certain type from the current selection, hover the pointer over the corresponding item in the Legend pane and click the Remove from selection icon.
To open a file, double-click it.
To pan the dependency graph, hold the Space key, click and drag the mouse. Alternatively, press and hold the mouse wheel and drag.
For large graphs, navigate using the Overview pane.
To zoom in and out, in the Navigate section, click Zoom In and Zoom Out. Alternatively, use the mouse wheel.
To center and fit the dependency graph to view, in the Navigate section, click Fit to View. Alternatively, press the Space bar.
Investigate Dependency Between Two Files
To see more information about how two files are related, select their dependency arrow. In the Properties pane, in the Details section, you can see the full paths of the files you are examining, the dependency type (such as function call, inheritance, S-function, data dictionary, model reference, and library link), and where the dependency is introduced.
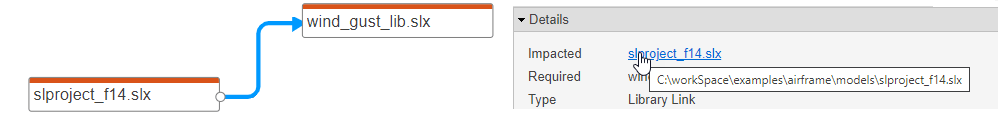
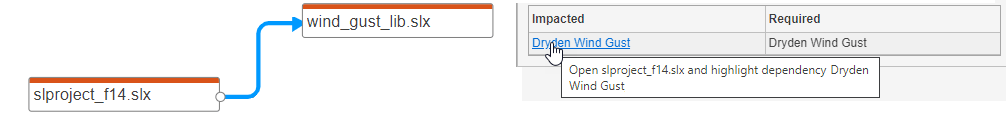
To open the file and highlight where the dependency is introduced, in the Details section, click the link under Impacted.
Color Files by Type, Status, or Label
Explore the different views in the Views section of the Dependency Analyzer toolstrip to explore your project files dependencies.
The MATLAB Files view shows only MATLAB® files (such as
.m,.mlx,.p,.mlapp,.fig,.mat, and.mex) in the view and colors them by type.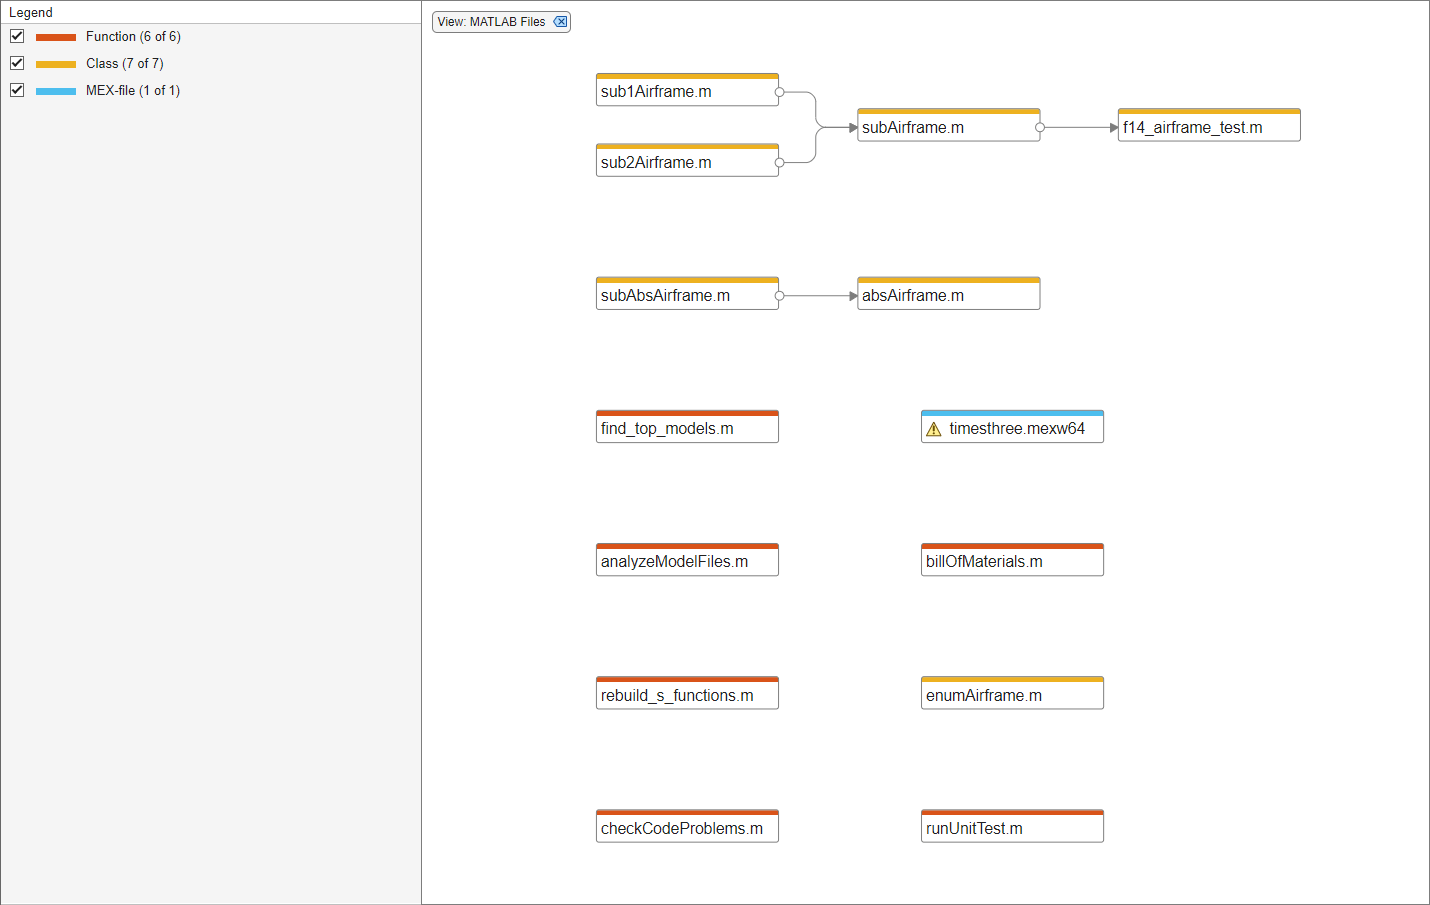
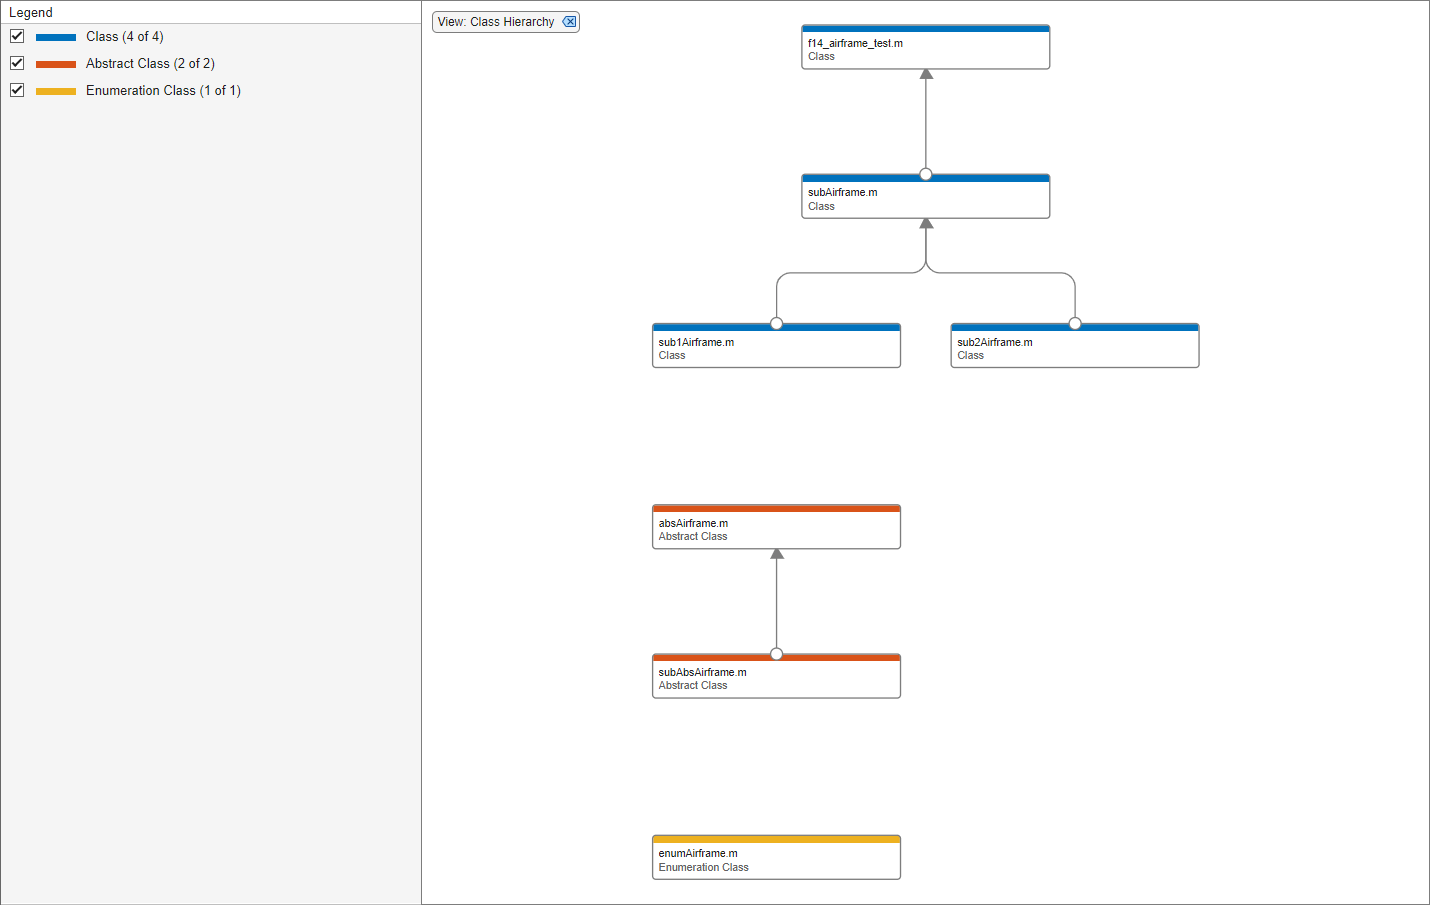
The Class Hierarchy view shows the class inheritance graph and colors the files by type (class, enumeration class, or abstract class). If the class is not on the search path, the Dependency Analyzer cannot determine the class type.
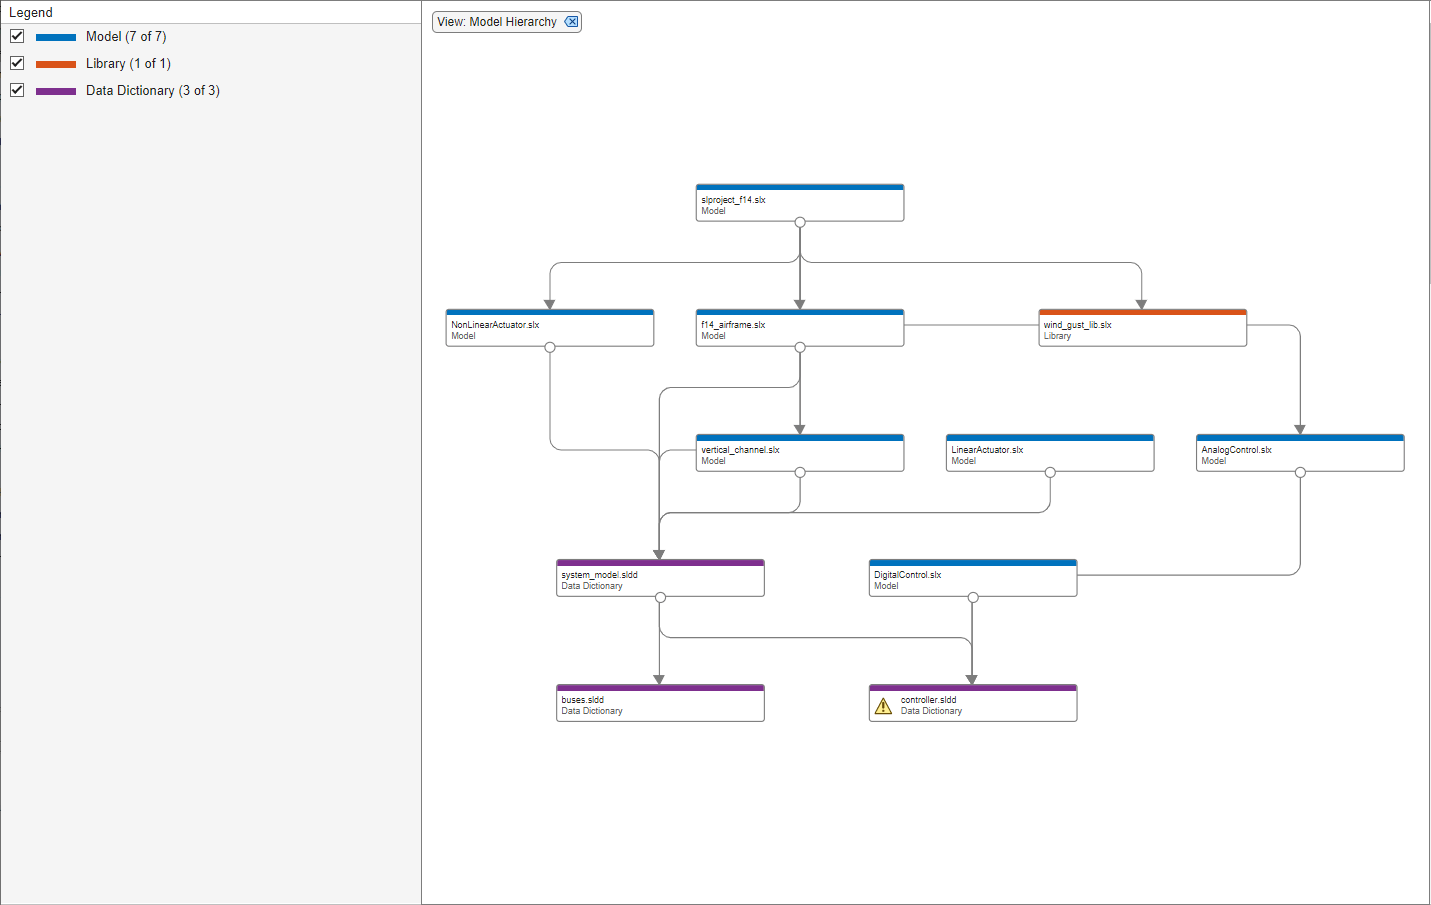
The Model Hierarchy view shows the model, subsystem, library and data dictionary files referenced by a top model. A referenced file appears only once in the view even if it is referenced more than once in the model. For more details, see Model Hierarchy View.
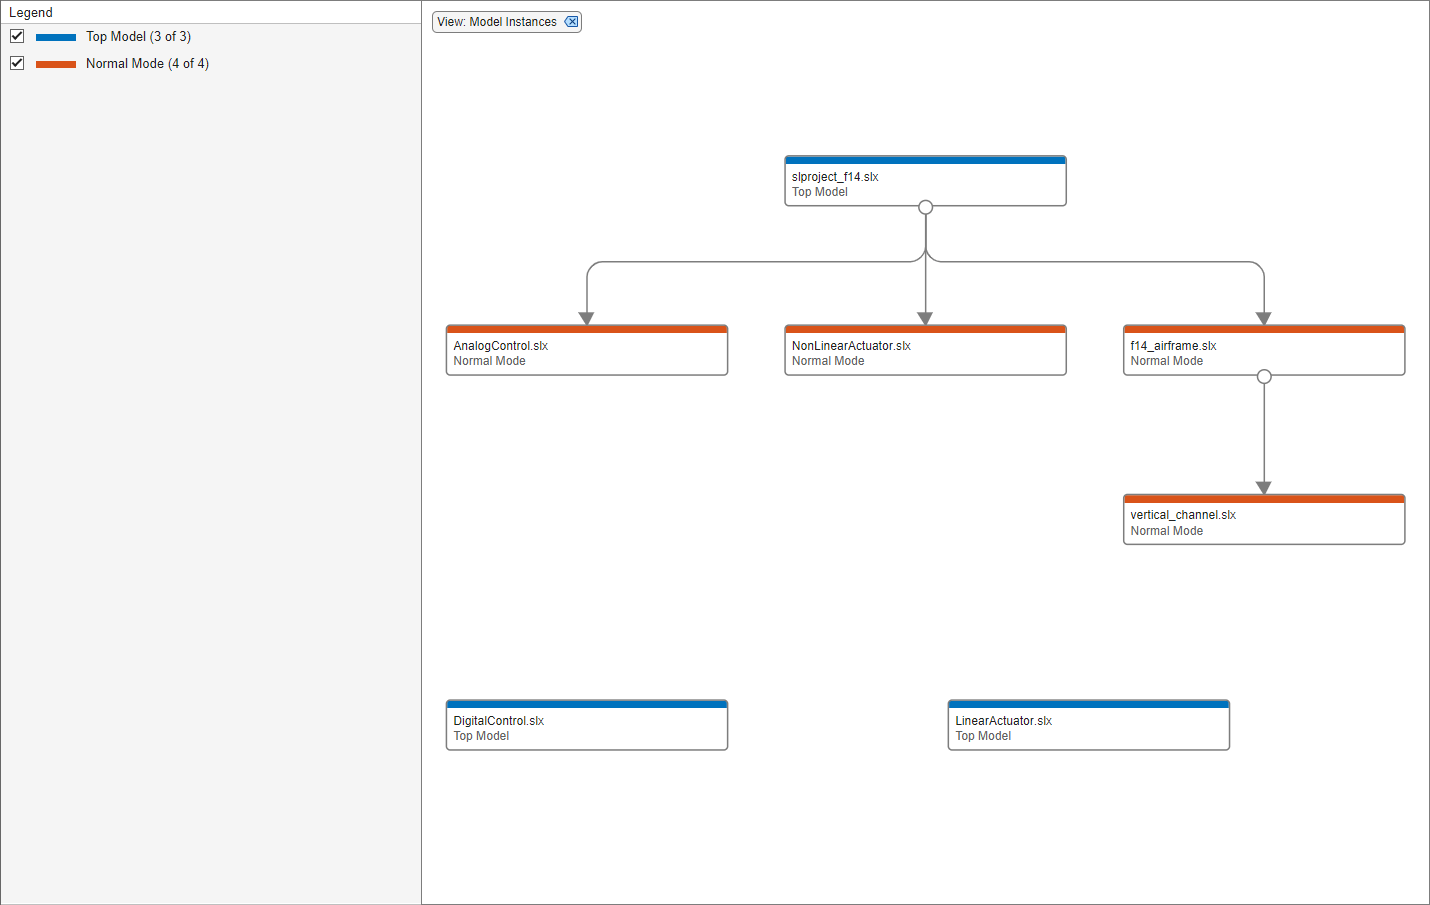
The Model Instances view shows every instance to a model in a model reference hierarchy. A top model is at the root of this hierarchy. If a model hierarchy references the same model more than once, the referenced model appears multiple times in the instance view. For more details, see Model Instances View.
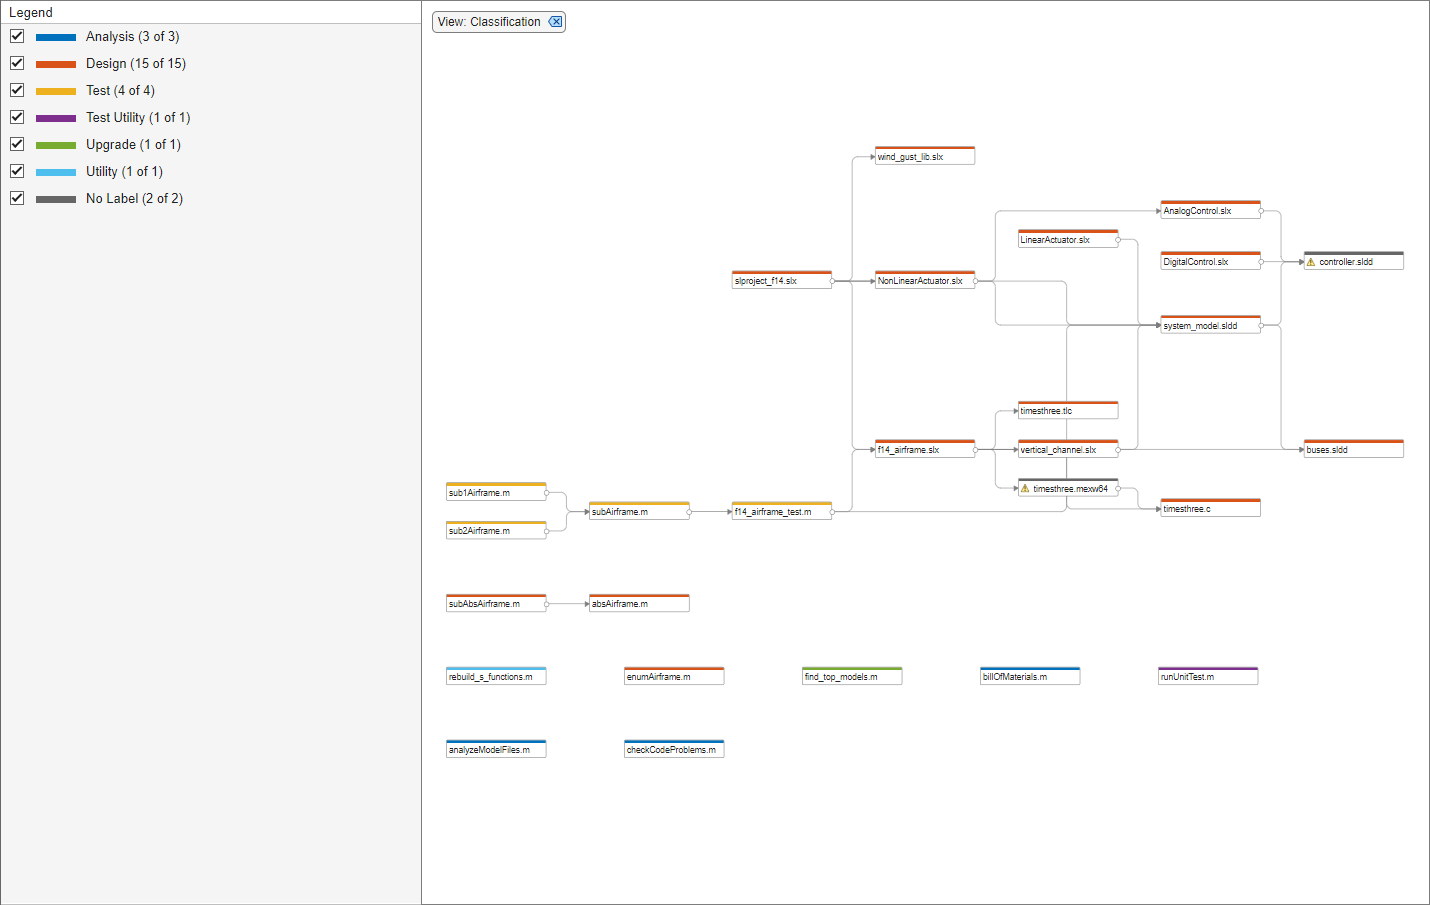
The Classification view shows all files in the graph and colors them by file label (such as test, design, and artifact).
Use the classification view to identify which tests you need to run to validate the changes in your design. For more information, see Identify Tests to Run.
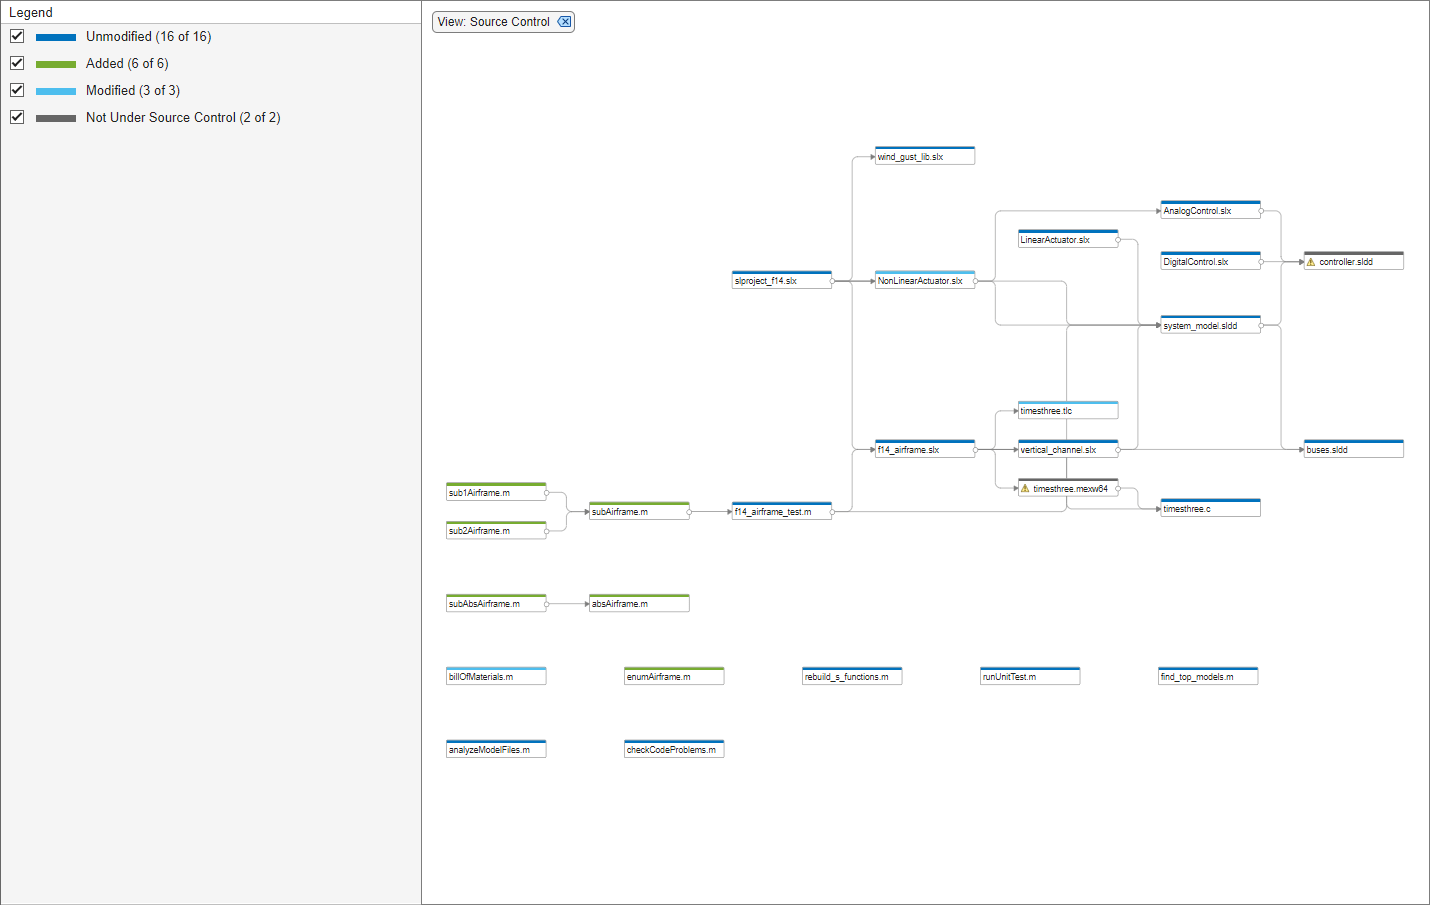
The Source Control view shows all files in the graph and colors them by source control status. This view is only enabled if your project is under source control.
Use the source control view to find modified files in your project and to examine the impact of these changes on the rest of the project files. For more information, see Investigate Impact of Modified Files.
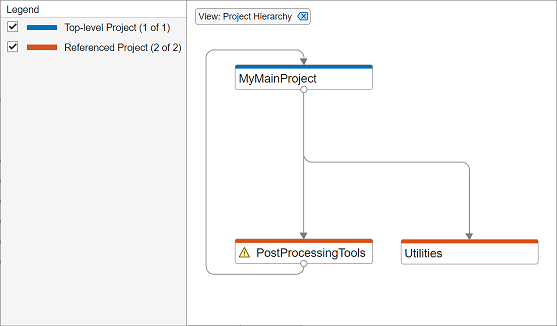
The Project Hierarchy view shows all projects in your project hierarchy in the graph and colors them by project type, top-level or referenced project. This view is available only in MATLAB Online™.
Use the project hierarchy view to investigate how projects in your hierarchy relate to each other and identify projects that introduce circular dependencies.
Restore to Default clears all filters.
This is equivalent to manually removing all of the filters. Filters appear at the top of the graph. For example, if you have the Source Control view selected, you can remove it by clicking
 .
.
Apply and Clear Filters
In large projects, when investigating problems or dependencies, use the different filters to show only the files you want to investigate:
To filter out a subgroup of files from the graph, such as files labeled
testor modified files, use the check boxes in the Legend pane. To remove the legend filter, click the Legend Filter .
.To color the files in the graph by type, class, label, or source control status, use the filtered Views. To remove the view filter, click View:
viewNameat the top of the graph. For example, if you have the Source Control view selected, you can remove it by clicking.To show only the dependencies of a specific file, select the file and, in the Impact Analysis section, click All Dependencies. The graph shows the selected file and all its dependencies. To reset the graph to show all project dependencies, remove the filter at the top of the graph. For example, if you filtered by all dependencies of
NonLinearActuator.slx, to remove the filter click .
.To clear all filters and restore the graph to show all analyzed dependencies in the project, click Restore to Default. Alternatively, manually remove all filters at the top of the graph.
Related Topics
You can also select a web site from the following list
Americas
- América Latina (Español)
- Canada (English)
- United States (English)
Europe
- Belgium (English)
- Denmark (English)
- Deutschland (Deutsch)
- España (Español)
- Finland (English)
- France (Français)
- Ireland (English)
- Italia (Italiano)
- Luxembourg (English)
- Netherlands (English)
- Norway (English)
- Österreich (Deutsch)
- Portugal (English)
- Sweden (English)
- Switzerland
- United Kingdom (English)
Asia Pacific
- Australia (English)
- India (English)
- New Zealand (English)
- 中国
- 日本Japanese (日本語)
- 한국Korean (한국어)