TimeScopeConfiguration
Control Scope block appearance and behavior
Description
Scope configuration properties control the appearance and behavior of a scope
block. Create a scope configuration object with get_param, and then
change property values using the object and the dot notation.
Creation
myScopeConfiguration = get_param(gcbh,'ScopeConfiguration')
creates a scope configuration object for the selected scope block.
Properties
Name of scope window, specified as a character vector or string scalar.
Size and location of the scope window, specified as a four-element vector
in pixels of the form [left bottom width height].
By default, a scope window appears at the center of your screen with a
width of 560 pixels and height of 420
pixels.
Visibility of the scope window, specified as true or
false. Set this property to true
to make the scope window visible.
Option to open scope when starting simulation, specified as
true or false. Set this property
to true to open the scope when the simulation
starts.
Display full path, specified as true or
false. Set this property to true
to display the full path of the scope relative to the model on the top of
the scope window. If you set this property to false, only
the name of the scope block appears on the top of the scope window.
The Scope Viewer does not support this property.
Preserve colors when copying to clipboard, specified as
true or false. Set this property
to true to maintain the background color of the scope and
the signal colors while copying the scope to clipboard. When you paste this
scope to a document or print this scope, the colors are retained. If you set
this property to false and copy the scope to clipboard,
colors change to a toner friendly version when you paste or print the
scope.
Number of input ports on a scope block, specified as a character vector or string scalar. The maximum number of input ports is 96.
Number of display rows and columns, specified as a two-element vector. The maximum layout dimension is 16-by-16.
If the number of displays is equal to the number of ports, signals from each port appear on separate displays.
If the number of displays is less than the number of ports, signals from additional ports appear on the last y-axis.
If the number of displays is greater than the number of ports, the scope creates empty tiles.
Time interval between Scope block updates during a simulation, specified as a character vector or string scalar. This property does not apply to floating scopes and scope viewers.
Frame-based processing of signals, specified as true or
false. Set this property to true
to process each column of the input as an independent channel (frame-based
processing). Frame-based processing is available only with discrete input
signals.
Set this property to false to process each element of
the input as an independent channel (sample-based processing).
Maximize size of signal plots, specified as one of these options:
'Auto'— Maximize all plots if you do not specifyTitleandYLabel. If one of the plots has a user-defined title or a y-axis label, the scopes sets theMaximizeAxesproperty to'Off'.'On'— Maximize all plots and hide values inTitleandYLabel.'Off'— Do not maximize plots.
Each of the plots expands to fit the full display. Maximizing the size of signal plots removes the background area around the plots.
Hide menu and toolbar, specified as true or
false. Set this property to true
to hide the menu and toolbar.
If you dock the scope, this property is inactive.
Method to scale y-axes, specified as one of these values:
'Manual'— Manually scale y-axes using theYLimitsproperty or the pan and zoom operations on the scope display.'Auto'— Scale y-axes during and after simulation.'Updates'— Scale y-axes after the number of block updates (time intervals) you specify in theAxesScalingNumUpdatesproperty.
Number of updates before scaling y-axes, specified as a character vector or string scalar.
Dependencies
To enable this property, set AxesScaling to
'Updates'.
Length of x-axis range to display, specified as one of these values:
'Auto'— Difference between the simulation start and stop times.'One frame period'— Use the frame period of the input signal. This option is available only when you set theFrameBasedProcessingproperty totrue.Positive real number — Any value less than the total simulation time specified as a character vector or string scalar.
The block calculates the beginning and end times of the
x-axis range using the
TimeDisplayOffset and TimeSpan
properties. For example, if you set TimeDisplay to
10 and the TimeSpan to
20, the scope sets the x-axis
range from 10 to 30.
Method to display data beyond the visible x-axis range, specified as one of these values:
'Wrap'— Draw a full screen of data from left to right, clear the screen, and then restart drawing of data.'Scroll'— Move old data to the left to display new data on the right. This mode is graphically intensive and can affect run-time performance.
You can see the effects of this option only when plotting is slow with large models or small step sizes.
Units to display on the x-axis, specified as one of these values:
'Metric'— Display time units based on the length of theTimeSpanproperty.'None'— DisplayTimeon the x-axis.'Seconds'— DisplayTime (seconds)on the x-axis.
x-axis range offset number, specified as a character vector or string scalar. For input signals with multiple channels, enter a scalar or vector of offsets.
Scalar — Offset all channels of an input signal by the same value.
Vector — Independently offset the channels.
Location of x-axis labels display, specified as one of these:
'All'— Display x-axis labels on all displays.'Bottom'— Display x-axis labels only on the bottom display.'None'— Do not display labels and deactivateShowTimeAxisLabelproperty.
Set ShowTimeAxisLabel to true and
set Maximize axes to 'Off'.
Display or hide x-axis labels, specified as
true or false. Set this property
to true to display the x-axis
labels.
Set the ActiveDisplay property before setting this
property.
If you set this property to true, you must also set
TimeAxisLabels. If you set
TimeAxisLabels to 'None', this
property is inactive.
Scope display for setting display-specific properties, specified as a character vector or a string scalar. The display number corresponds to its column-wise placement index. For multi-column layouts, the displays are numbered down and then across.
Display-specific properties include ShowGrid,
ShowLegend, Title,
PlotAsMagnitudePhase, YLabel,
and YLimits.
Display title, specified as a character vector or string scalar. The
default value %<SignalLabel> uses the input signal
name for the title.
Set the ActiveDisplay property before setting this
property.
Signal legend, specified as true or
false. Set this property to true
to display the legend.
Names listed in the legend are the signal names from the model. For signals with multiple channels, a channel index is appended after the signal name. See the Scope block page for an example.
Set the ActiveDisplay property before setting this
property.
Display vertical and horizontal grid lines, specified as
true or false. Set this property
to true to display vertical and horizontal grid lines on
active display.
Set the ActiveDisplay property before setting this
property.
Option to display the magnitude and phase plots, specified as one of these:
false— Display signal plot.If the signal is complex, the scope plots the real and imaginary parts on the same y-axis (display).
true— Display magnitude and phase plots.If the signal is real, the scope plots the absolute value of the signal for the magnitude. The phase in the phase plot is 0 degrees for positive values and 180 degrees for negative values.
Set the ActiveDisplay property before setting this
property.
Minimum and maximum values of y-axis for active display, specified as a two-element numeric vector.
Set the ActiveDisplay property before setting this
property.
When PlotAsMagnitudePhase is true,
this property specifies the y-axis limits for the
magnitude plot. The y-axis limits of the phase plot are
always [-180 180].
y-axis label for active display, specified as a character vector or string scalar.
Set the ActiveDisplay property before setting this
property.
If PlotAsMagnitudePhase is true,
the value of YLabel is hidden and plots are labeled
Magnitude and Phase.
Save scope data, specified as true or
false. Set this property to true
to save scope data to a variable in the MATLAB® workspace. This property does not apply to floating scopes and
scope viewers.
If you set this property to true, you must also specify
the properties DataLoggingVariableName and
DataLoggingSaveFormat.
This property does not apply to floating scopes and scope viewers.
Variable name for saving scope data in the MATLAB workspace, specified as a character vector or string scalar. This property does not apply to floating scopes and scope viewers.
This property does not apply to floating scopes and scope viewers.
Dependencies
To enable this property, set DataLogging to
true.
Limit buffered data, specified as true or
false. Set this property to true
to limit buffered data before plotting and saving data.
For simulations with Stop Time of
inf, set this parameter to
true.
If you set this property to true, also specify the
number of data values to plot and save with the
DataLoggingMaxPoints property.
Maximum number of data values to plot and save, specified as a character vector or string scalar. The scope plots and saves the data values from the end of a simulation. For example, setting this property to 100 saves the last 100 data points.
Dependencies
To enable this property, set
DataLoggingLimitDataPoints to
true. Specifying this property limits the data
values a scope plots and saves in the MATLAB variable specified in
DataLoggingVariableName.
Reduce scope data, specified as true or
false. Set this property to true
to reduce scope data before plotting and saving.
If you set this property to true, you must also specify
the DataLoggingDecimation property.
Decimation factor applied to the signal data before plotting and saving,
specified as a character vector or string scalar. The scope buffers every
Nth data point, where
N is the decimation factor you specify. A value of
1 buffers all data values.
Dependencies
To enable this property, set
DataLoggingDecimateData to
true.
Variable format for saving scope data to the MATLAB workspace, specified as one of these values:
'Dataset'— Save data as adatasetobject. This format does not support variable-size data, MAT file logging, or external mode archiving. For more information, seeSimulink.SimulationData.Dataset.'StructureWithTime'— Save data as a structure with associated time information. This format does not support single- or multiport data, or multirate data.'Structure'— Save data as a structure. This format does not support multirate data.'Array'— Save data as an array with associated time information. This format does not support single- or multiport data, variable-size data, or multirate data.
This property does not apply to floating scopes and scope viewers.
Dependencies
To enable this property, set DataLogging to
true.
Examples
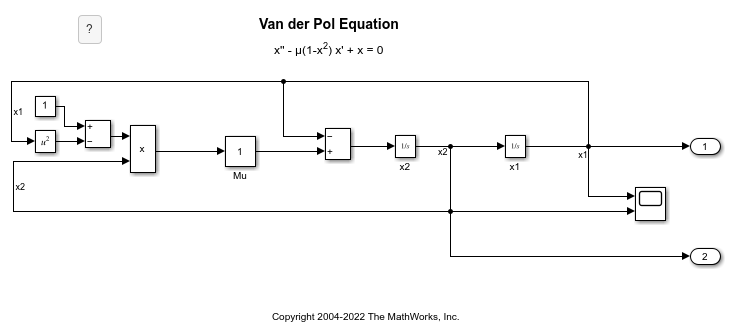
Create a scope configuration object using the 'vdp' model which models the van der Pol equation.
open_system('vdp')
myScopeConfiguration = get_param('vdp/Scope','ScopeConfiguration');
myScopeConfiguration.NumInputPorts = '2';
Version History
Introduced in R2013a
See Also
Scope | Floating Scope | Time Scope (DSP System Toolbox)
MATLAB Command
You clicked a link that corresponds to this MATLAB command:
Run the command by entering it in the MATLAB Command Window. Web browsers do not support MATLAB commands.
Select a Web Site
Choose a web site to get translated content where available and see local events and offers. Based on your location, we recommend that you select: .
You can also select a web site from the following list
How to Get Best Site Performance
Select the China site (in Chinese or English) for best site performance. Other MathWorks country sites are not optimized for visits from your location.
Americas
- América Latina (Español)
- Canada (English)
- United States (English)
Europe
- Belgium (English)
- Denmark (English)
- Deutschland (Deutsch)
- España (Español)
- Finland (English)
- France (Français)
- Ireland (English)
- Italia (Italiano)
- Luxembourg (English)
- Netherlands (English)
- Norway (English)
- Österreich (Deutsch)
- Portugal (English)
- Sweden (English)
- Switzerland
- United Kingdom (English)