plot
Plot data in Simulation Data Inspector
Description
Use the plot function to plot data contained in objects such
as Dataset, SimulationOutput, or Signal
objects in the Simulation Data Inspector.
For more information about interactively plotting data in the Simulation Data Inspector and customizing the plot appearance, see Create Plots Using the Simulation Data Inspector.
To create a 2-D line plot in a MATLAB® figure, see plot.
plot( plots the simulation results in the
object obj)obj in the Simulation Data
Inspector and opens the Simulation Data Inspector. You can use the
plot function to plot data and simulation results stored in an object
such as:
When the input object contains fewer than eight signals, the Simulation Data Inspector
layout changes to 1-by-n, where n
is the number of signals, and each subplot displays one signal. When the simulation results
contain more than eight signals to plot, the Simulation Data Inspector layout changes to
1-by-1, and the plot displays the first
signal.
runObj = plot(___)Simulink.sdi.Run object that corresponds to
the plotted data.
Examples
Open the model vdp, which models the second-order Van der Pol differential equation. You can use the plot function to plot the simulation results in the Simulation Data Inspector.
mdl = "vdp";
open_system(mdl)
Configure the model to log signals, outputs, and states.
set_param(mdl,"SignalLogging","on")
set_param(mdl,"SaveOutput","on")
set_param(mdl,"SaveState","on")
Mark the x1 and x2 signals for logging.
Simulink.sdi.markSignalForStreaming('vdp/Mu',1,'on')
Simulink.sdi.markSignalForStreaming('vdp/Product',1,'on')
Simulink.sdi.markSignalForStreaming('vdp/Square',1,'on')
Simulink.sdi.markSignalForStreaming('vdp/Sum',1,'on')
Simulate the model and return all logged data as a single simulation output named out. The model logs data using the Dataset format, so all the logged data streams to the Simulation Data Inspector during simulation.
out = sim(mdl);
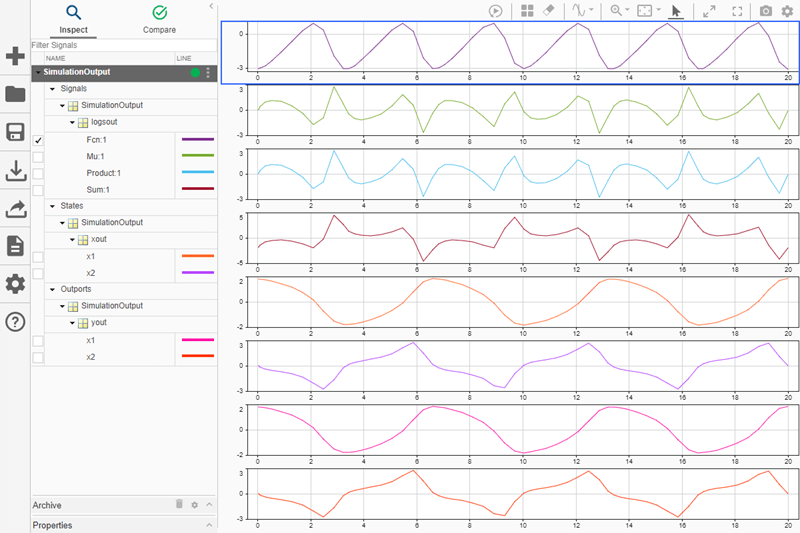
Use the plot function to plot all the simulation results in the Simulation Data Inspector. The Simulation Data Inspector updates to a 1-by-8 layout and plots one signal on each subplot.
plot(out)
You can also use the plot function to plot data for a single signal or a subset of the simulation results. When you plot the data for a single signal, the Simulation Data Inspector always imports the data for the signal into a new run.
The Simulink.SimulationOutput object contains a property for each logging variable. Access the signal logging data in the property logsout.
logsout = out.logsout
logsout =
Simulink.SimulationData.Dataset 'logsout' with 6 elements

                         Name  BlockPath
                         ____  ___________
    1  [1x1 Signal]      ''    vdp/Mu
    2  [1x1 Signal]      ''    vdp/Product
    3  [1x1 Signal]      ''    vdp/Square
    4  [1x1 Signal]      ''    vdp/Sum
    5  [1x1 Signal]      x1    vdp/x1
    6  [1x1 Signal]      x2    vdp/x2

  - Use braces { } to access, modify, or add elements using index.
Use the get function for the Dataset object to access the data for the first element, which contains the data for a single logged signal.
sig1 = get(logsout,1);
When you plot the signal data, the Simulation Data Inspector imports the signal into a new run, updates the layout to 1-by-1, and plots the signal.
plot(sig1)

Create two timeseries objects.
ts1 = timeseries([0;20],[0;10]);
ts2 = timeseries([0;40],[0;10]);
Create a Dataset object. Then, add the timeseries objects to the Dataset object.
ds = Simulink.SimulationData.Dataset;
ds = addElement(ds,ts1,"timeseries1");
ds = addElement(ds,ts2,"timeseries2");
Plot the Dataset object in the Simulation Data Inspector.
plot(ds)