Signal Editor
Create and edit input signals
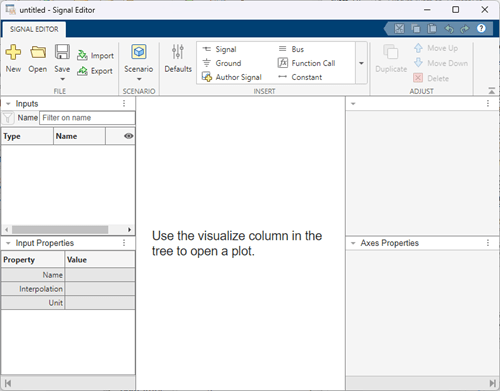
Description
The Signal Editor tool lets you create and edit input signals that you can organize for multiple simulations.
Mouse, Keyboard, and Touchscreen Shortcuts
You can use these keyboard shortcuts to interact with the Signal Editor.
Edit actions:
| Action | Keyboard | Mouse | Multi-Touch |
|---|---|---|---|
Insert point | Ctrl+P | Click | Tap |
Insert line | Ctrl+L | Click | Pan and pinch |
Draw | Ctrl+D | Click and draw | Pan |
Select a point | Ctrl+T | Click To select all areas, double-click | Pan and pinch To select all areas, double-tap |
Move a point | Ctrl+M | Click | Tap and move |
| Continuously delete points on a line | Click | ||
| Fit to view if zoom action is selected | Spacebar | Triple tap | |
| Fit to view when signal table is updated | Spacebar | ||
| Zoom out | Ctrl+- | Two mouse clicks, if zoom action is selected | Double tap |
| Expand along the x-axis | Ctrl+mouse pan | Touch and drag along the x-axis in opposite directions | |
| Expand along the y-axis | Shift+mouse pan | Touch and drag along the y-axis in opposite directions |
Zoom actions:
| Type of Zoom or Pan | Action |
|---|---|
Zoom in along the T and Y axes. | Click |
Zoom in along the time axis. After selecting the icon, on the graph, drag the mouse to select an area to enlarge. | Click |
Zoom in along the data value axis. After selecting the icon, on the graph, drag the mouse to select an area to enlarge. | Click |
Zoom only in x while zooming in xy. | Zoom in xy while pressing Ctrl |
Zoom only in y while zooming in xy. | Zoom in xy while pressing Shift |
Zoom out from the graph. | Click |
Fit the plot to the graph. After selecting the icon, click the graph to enlarge the plot to fill the graph. | Click |
Pan the graph up, down, left, or right. Select the icon. On the graph, hold the left mouse button and move the mouse to the area of the graph that you want to view. | Click |
Snap to Grid for Alignment
You can use these alignment commands to snap to the plot grid for accuracy.
| Action | Snap to Grid |
|---|---|
Snap values to x grid lines for point and line insertion and movement and zooming. | Snap X to Grid |
Snap values to y grid lines for point and line insertion and movement and zooming. | Snap Y to Grid |
Snap values to x minor grid lines for point and line insertion and movement and zooming. | Snap X to Tick |
Snap values to y grid lines for point and line insertion and movement and zooming. | Snap Y to Tick |
Snap to incremental value in X grid. | Snap X to Increment |
Snap to incremental value in Y grid. | Snap Y to Increment |
Turn plot markers on and off. | Markers |
Signal Selections
You can use these keyboard shortcuts to select multiple signals in scenarios.
| Action | Snap to Grid |
|---|---|
Select all signals with the same under all scenarios | F3 |
Select all the signals under the same scenario | F4 |
Select all scenario children | Shift+F4 |
Select all scenarios | F1 |
Open the Signal Editor
MATLAB® Command Window: Enter
signalEditor.Root Inport Mapper: To create a MAT-file for your new signal data, select Signals > New MAT-File. To link in an existing signal data file from an existing scenario and edit the signals in that file, use the Signals > Edit MAT-File.
Signal Editor block: Click
 .
.Note
The Signal Editor block opens a version of the Signal Editor tool that has some parameters related to the block.
Simulink® Editor toolstrip:
In the Prepare section of the Simulation tab, click the expander.
Click Inputs & Parameter Tuning > Signal Editor.
Signals can be:
MATLAB
timeseriesobjects.timeseriesobjects cannot have emptyDataproperties.timetableobjects.timetableobjects cannot represent multiple variables.Structure of MATLAB
timeseriesortimetableobjects.Two-dimensional matrices.
Examples
In the Inputs pane, you can change signal names and hierarchy order, create duplicates of signals, and delete signals. The software ignores leading and trailing spaces in signal names.
To change a signal name, double-click the name and enter a new name.

To change the unit or interpolation of a signal, in the Inputs pane, select the signal you want to edit, then navigate to the Input Properties pane, and update the Unit or Interpolation value.

To change the order of a signal in the hierarchy, drag and release the signal. For example, you can drag and release signals into a bus.

Alternatively, in the Adjust section, use the Move Up and Move Down buttons.
To copy a signal and paste it under the original, right-click the signal and select Duplicate Signal.
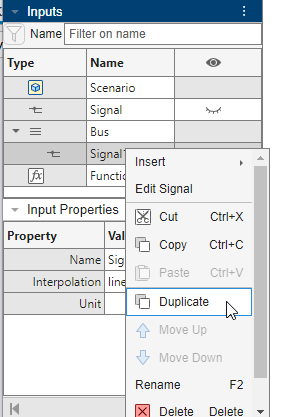
Alternatively, in the Adjust section, use the Duplicate button. You can also adjust the default properties of the signal you duplicate. For more information, see Create Signals with the Same Properties.
To copy a signal and paste it elsewhere in hierarchy, select Copy and then Paste.
To create signals of the same predefined type, in the
Adjust section, use the Duplicate button. To
change the predefined signal type, click the Defaults icon
![]() . The Properties for Insertion dialog box opens.
. The Properties for Insertion dialog box opens.
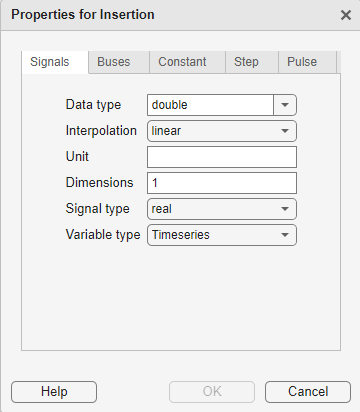
On the Signals tab:
Data type — From the list, select the signal data type.
Enumeration — When you select the
Enumdata type, this parameter displays. Enter the class name of your enumeration.If you define an enumeration class that contains the same integer value multiple times, the Signal Editor treats the first enumeration value as the canonical value and equates all subsequent instances of the same underlying integer to the enumerated name. In this example,
Red(118)) is canonical, soPinkequalsRed.classdef(Enumeration) hEnumColors_duplicateValues < Simulink.IntEnumType enumeration Red(118) Yellow(-14) Blue(90) Green(87) White(-14) Black(198) Brown(90) Pink(118) Purple(90) end methods (Static = true) function retVal = getDefaultValue() retVal = hEnumColors_duplicateValues.Blue; end end endInterpolation — From the list,select
linearorzero order hold.Unit — Enter an appropriate unit expression. For a suggested list of unit expressions, see Allowed Units.
Dimensions — Enter the number of dimensions for the signal. For a multidimensional blank signal, enter a dimension greater than
1.Signal type — From the list, select
realorcomplex.Variable type — From the list, select
Timeseries(default),Timetable,Logged timeseries, orLogged timetable.Logged
timeseriesand loggedtimetablesobjects areSimulink.SimulationData.Signalobjects whoseValueproperty is of data typetimeseriesortimetable.
On the Buses tab:
Bus object — From the list, select the bus object for which to define the dimensions. If you leave the Bus object parameter as the default
<object name>, the Signal Editor adds empty buses.Dimensions — Enter the number of dimensions for the bus object.
On the Constant tab:
Value — Enter constant value to output.
Time — Enter sample time.
On the Step tab:
Initial value — Enter output value before step.
Final value — Enter output value after step.
Start time — Enter time when step starts.
Step time — Enter time increment when step occurs.
Step final time — Enter final step time.
On the Pulse tab:
Initial value — Enter initial default value of signal.
Value at trigger — Enter value of signal at pulse trigger.
Pulse duration — Enter length of time of pulse.
Step time — Enter time when step occurs.
Trigger time — Enter time when pulse trigger occurs.
In the Inputs section, you can select multiple scenarios or signals simultaneously and perform actions on them.
Start Signal Editor.
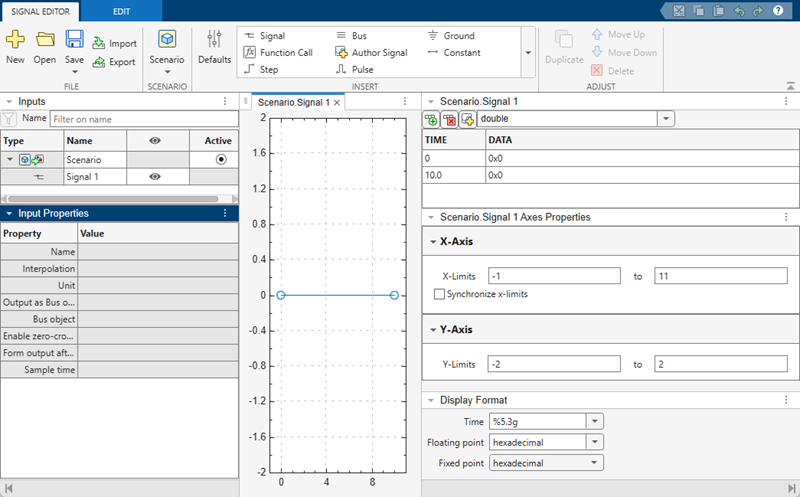
In the toolstrip, add two scenarios. Click Scenario twice.
To the first Scenario, add a basic signal and step. In
Insert, click Signal and
Step.
By default, basic signals are created with linear interpolation while step signals are created with zero-order hold (ZOH) interpolation.
Change the interpolation of both signals to linear. In the
Inputs pane, select both Signal and
Step. Observe that in the Input Properties
pane, the Interpolation field now shows <mixed
values>.
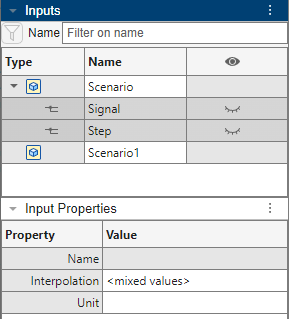
In the Interpolation field, type linear.
Individually select Signal and Step and observe
that they now both have linear interpolation.
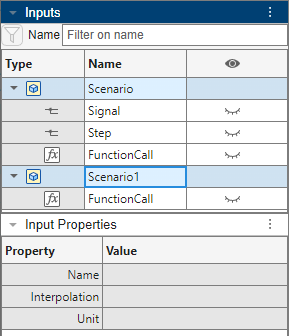
Add the same signal types to both scenarios. In the Inputs
pane, select Scenario and Scenario1. Then in the
Insert pane, click Function Call.
Exchange rows and columns of data between Signal Editor and Excel® spreadsheets using cut, copy, and paste operations.
If you do not have an existing Excel spreadsheet, create an Excel spreadsheet and data.
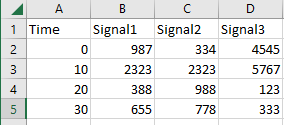
Select and copy two adjacent items, such as A5 and
B5.
In Signal Editor, create a signal and double-click the hide icon (![]() ).
).
In the signal pane, select two adjacent cells.
Paste the contents from the spreadsheet to the Signal Editor data table.
Tip
You can cut, copy, and paste directly into a spreadsheet or Signal Editor data table. However, if you cut, copy, and paste to a selected target area, the selected target area must be the same size as the source area.
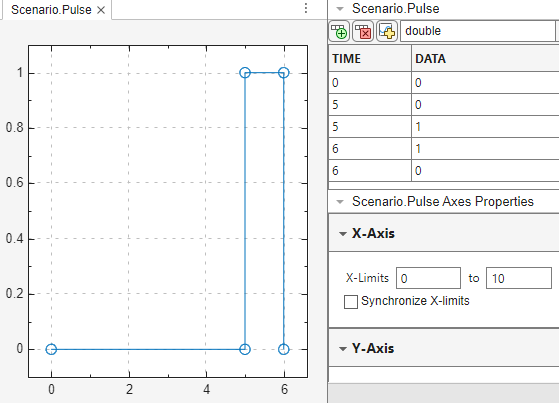
In the Signal Editor tab, create signal data from the standard waveform options.
Constant — Straight line waveform with a default value of 1.
Step — Step waveform with default initial value of
0and final value of5.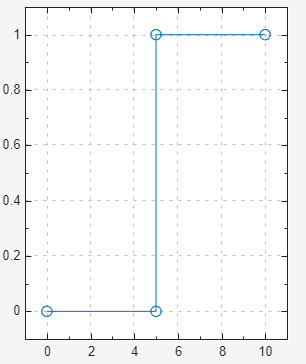
Pulse — Pulse waveform with default initial value of
0, pulse at trigger5, and pulse duration of 1.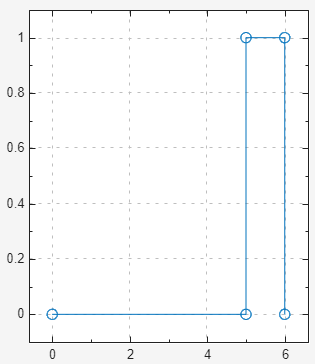
To change the data from these waveforms, you can manually modify them in the plot. If you want to create multiple waveform plots with the same set of initial data, you can change the default signal properties for the waveform.
Start Signal Editor.
In the toolstrip, click Scenario.
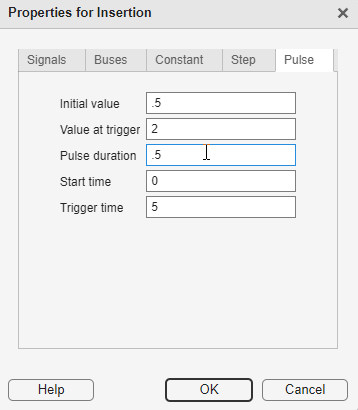
To add a pulse waveform to the scenario, select the scenario and from the Insert section, select Pulse.
In the signal hierarchy, double-click the hide icon (![]() ).
).
To change the default of the pulse waveform and its data, in the toolstrip, click
Defaults (![]() ).
).
In the Properties for Insertion dialog box, on the Pulse tab, change the values as desired.
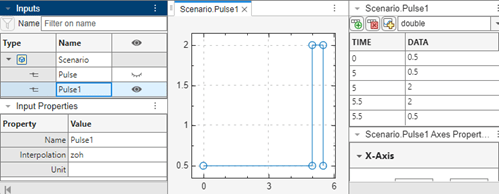
To add a second pulse waveform to the scenario, select the scenario, and from the Insert section, click Pulse.
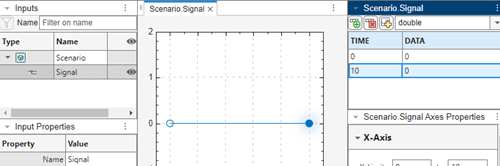
You can add and delete data to the signals in a linked scenario. To create a model to work with, see Add Signals to Scenarios.
In the MATLAB Command Window, create data by entering this command:
ts = timeseries([0;20],[0;10]);
Add a scenario. Click Scenario.
In the Signal Editor, in the File section, click Import.
In the Import window, in the Select signals to import pane,
select the ts signal and click OK.
Drag the ts signal into the scenario.
In the Signal Editor, in the Inputs pane, double-click the hide
icon (![]() ) for the signal
) for the signal ts.
The focus moves to the Edit tab.
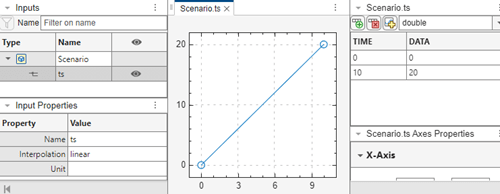
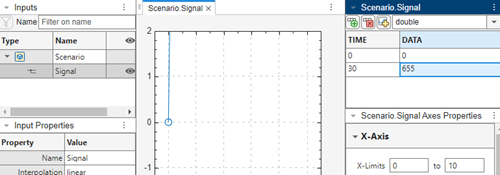
Add data to the signal ts.
In the Scenario.ts pane, click the add row icon (
 ), and add signals. To add a signal row between
other signals, click the signal above, then click the add row icon.
), and add signals. To add a signal row between
other signals, click the signal above, then click the add row icon. When done, click anywhere in the pane to update the plot. To reorient the plot, click Fit to View.
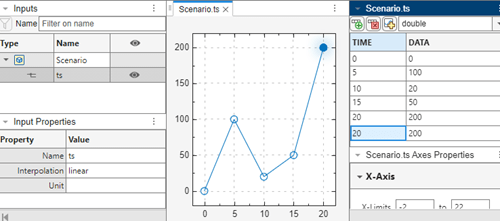
Remove the time 20 line from the signal. Select 20 and click ![]() .
.
Alternatively, if you want to replace all the signal data for ts
with a signal defined with signal notations, click the replace button
![]() and use the Author and Replace Signal Data dialog box
to define new data.
and use the Author and Replace Signal Data dialog box
to define new data.
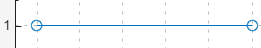
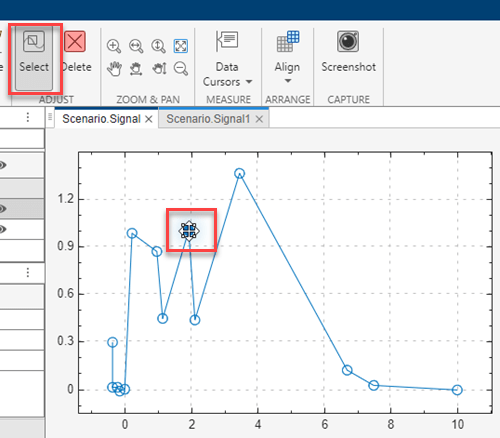
You can move one signal point, two signal points, or an entire plot in Signal Editor. Create a plot to work with, for example, see Create Freehand Signal Data Using Mouse or Multi-Touch Gestures.
Click the Select
![]() button. This action persists until you select another
action.
button. This action persists until you select another
action.
Click a point. The move icon ![]() appears on top of the point.
appears on top of the point.
Drag the point to another area of the plot.
Tip
You cannot drag the point horizontally past adjacent points.
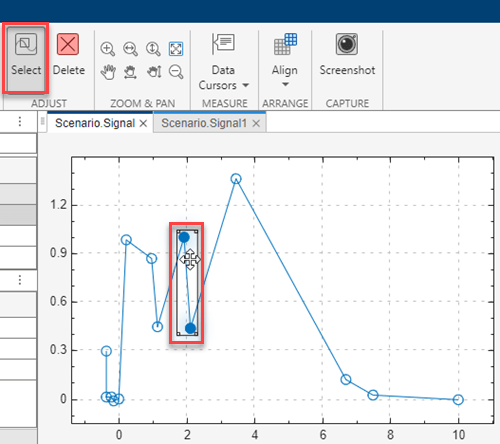
To move two contiguous signal points, click one point.
Click a point.
Click anywhere on the line between the two contiguous points.
Drag to the other point on the same line.
The move icon ![]() appears on top of the points.
appears on top of the points.
Drag the points to another area of the plot.
Tip
You cannot drag the point horizontally past adjacent points.
To move an entire plot, select the entire plot. Alternatively, double-click anywhere on the plot.
The move icon ![]() appears on top of the plot.
appears on top of the plot.
Drag the plot to another area of the canvas.

Related Examples
Parameters
File
Open a new Signal Editor session.
Open MAT-file containing signals to be displayed and edited in Signal Editor.
Save the contents of Signal Editor. Clicking this button also makes the signal data visible to the Signal Editor block.
Import signals from registered file types that Signal Editor supports. For more information, see Import Custom File Type.
Save signals to registered file types that Signal Editor supports. For more information, see Export Signals to Custom Registered File Types.
Scenario
Create scenario to contain signals.
Insert
Change the predefined signal type and properties by clicking
![]() . Use this button to define your own signal defaults,
such as signal dimensionality, data type, and so forth.
. Use this button to define your own signal defaults,
such as signal dimensionality, data type, and so forth.
Insert basic signal by clicking ![]() . For more information, see Work with Basic Signal Data.
. For more information, see Work with Basic Signal Data.
Insert function-call signal by clicking ![]() .
.
If you need a function-call signal for a root inport with explicit periodic sample time, insert a ground signal instead. Simulink then executes the function-call automatically.
Insert constant signal with value of 1 by clicking ![]() .
.
Insert bus by clicking ![]() . To the bus you can add signals using any of the other
signal insertions techniques.
. To the bus you can add signals using any of the other
signal insertions techniques.
Author signal using MATLAB expressions or workspace variables by clicking ![]() . The dialog box displays:
. The dialog box displays:

Time — Enter the range of time for the data.
Data — Enter the MATLAB expression for the signal.
Data type — Select or enter the signal data type.
doublesingleint8uint8int16uin16int32uint32booleanfixdt(1,16)fixdt(1,16,0)fixdt(1,16,2^0,0)stringEnum: <class name>
If you enter your time and data and then select a fixed-point data type, the Signal Editor displays a fixed-point proposed data type for your data.
To help you select a fixed-point data type, click the Show Histogram button (
 ). Clicking this button displays a plot of the
signal data using the selected fixed-point data type. The graph displays:
). Clicking this button displays a plot of the
signal data using the selected fixed-point data type. The graph displays:Column Information Values The negative, positive, and zero signal values. Potential Overflows Bins the signal values that may overflow. In-Range Bins the signal values that are within acceptable range. Potential Underflows Bins the signal values that may underflow. To see the difference that a data type may have on the histogram, select:
User Specified
Binary Scaling
Slope & Bias Scaling
For more information, see Histogram Plot of Signal (Fixed-Point Designer).
To apply the proposed fixed-point data type to your data, click the Use proposed data type button (
 ).
).
For more information, see Create Signals with MATLAB Expressions and Variables.
Insert step waveform signal with an initial value of 0 and a
final value of 1 by clicking ![]() .
.
Insert ground signal by clicking ![]() .
.
Insert pulse signal waveform signal with an initial value of 0,
trigger value of 1, and initial pulse duration of
1 by clicking ![]() .
.
Adjust
Copy signal and paste it under original signal.
Move signal up the signal hierarchy in a bus or scenario by clicking the signal and then clicking Move Up.
Move signal down the signal hierarchy in a bus or scenario by clicking the signal and then clicking Move Down.
Delete signal by selecting one or more signals and clicking ![]() .
.
Programmatic Use
Version History
Introduced in R2017bThe Open Signal Editor button in the Signal Editor
block ![]() now opens a version of the Signal Editor tool
that is synchronized with the Signal Editor block. In releases prior to
R2026a, all instances of the Signal Editor tool had the same characteristics.
For more information, see Differences Between the Signal Editors.
now opens a version of the Signal Editor tool
that is synchronized with the Signal Editor block. In releases prior to
R2026a, all instances of the Signal Editor tool had the same characteristics.
For more information, see Differences Between the Signal Editors.

The block version of the Signal Editor tool has these changes:
When you click Open Signal Editor, the Signal Editor tool now opens populated with the active scenario. The active plot shows the last signal in the scenario.
A new Active column in the hierarchy shows the active scenario for the block. To change the active scenario, click the associated button.
New input properties support the corresponding block parameters.
Signal Editor Block Signal Editor Interface Output as bus object
Output a bus signal
Bus object
Select bus object
Enable zero-crossing detection
Enable zero-crossing detection
Form output after final data value by
Form output after final data value by
Sample time
Sample time Note
The Interpolate data and Unit parameters of the Signal Editor tool are only reflected in the Signal Editor block when the block parameter Use properties from is set to
Signal data in MAT file.To change the active scenario in the Signal Editor tool, click the associated button in the hierarchy Active column, and then click Save. Closing the tool updates the Signal Editor block.
Block parameters become read-only when you open the Signal Editor tool. To change control from the Signal Editor tool to the Signal Editor block, close the Signal Editor tool.
To see parameter changes for an active signal from the Signal Editor block in the associated Signal Editor tool, click the active signal in the signal hierarchy.