Instrumentation Properties
View and edit logging and visualization properties for logged signal
Description
Use the Instrumentation Properties dialog box to configure logging and visualization settings for logged signals, including a data access callback function to process logged data during simulation and logging sample time.
For more information on viewing and editing signal properties, see Signal Properties.
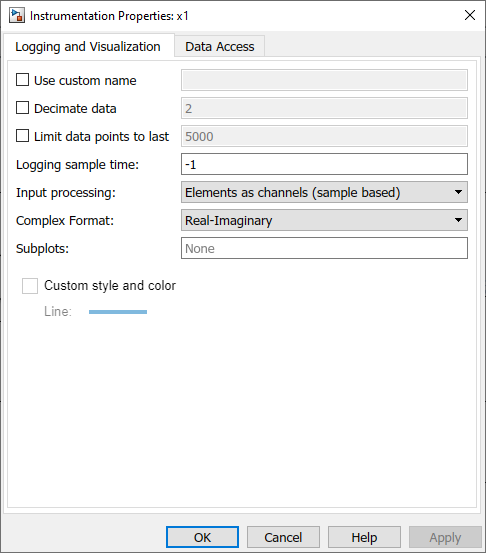
Open the Instrumentation Properties
Right-click the logging badge on a signal that is marked for logging, and then click Properties
 .
.
Parameters
Logging and Visualization
Select this option to specify a name for logged signal data that is different from the name of the signal in the model. By default, logged signal data uses the name of the signal specified in the model.
The Use custom name property is the same as the Logging name property that you configure using the Signal Properties dialog box.
Programmatic Use
To specify the logging name programmatically, use the set_param function to configure the
DataLoggingNameMode and DataLoggingName
parameters for the port handle that corresponds to the block output port that produces
the signal. For an example, see Name a Signal Programmatically.
Parameter:
DataLoggingNameMode |
Value:
"SignalName" | "Custom" |
Default:
"SignalName" |
Parameter:
DataLoggingName |
| Type: string | character vector |
When you want to reduce the effective sample rate for logged data, select
Decimate data and specify the desired decimation factor in the
text box. For example, if you specify a decimation factor of 2, every
other signal value is logged.
Consider data requirements for each signal before reducing the number of data points logged in simulation. Decimation can cause aliasing if the effective sample rate is too low.
For more information, see Specify Signal Values to Log and Limit Size of Logged Data.
Programmatic Use
To configure this option programmatically, use the set_param function to configure the
DataLoggingDecimateData and
DataLoggingDecimation parameters for the port handle that
corresponds to the block output port that produces the signal.
Parameter:
DataLoggingDecimateData |
Value:
"on" | "off" |
Default:
"off" |
Parameter:
DataLoggingDecimation |
| Value:positive integer |
| Type: string | character vector |
Default:
"2" |
When you only want to save or analyze the data from the end of a simulation, you can configure logging to capture only the last n signal values. Select Limit data points to last and specify the number of data points you want to log.
When you only log the last simulation values, dashboard blocks and the Simulation Data Inspector do not display data during simulation. Consider data requirements for each signal before you reduce the number of data points logged in simulation.
Limiting logged data to the last n signal values directly impacts memory allocation. When you specify this parameter, the software allocates memory upfront based on the specified value, not on the time steps generated during the simulation. For this reason, the Limit data points to last parameter is not recommended when logging an indeterminate number of time steps.
For more information, see Specify Signal Values to Log and Limit Size of Logged Data.
Programmatic Use
To configure this option programmatically, use the set_param function to specify the
DataLoggingLimitDataPoints and
DataLoggingMaxPoints parameters for the port handle that
corresponds to the block output port that produces the signal.
Parameter:
DataLoggingLimitDataPoints |
Value:
"on" | "off" |
Default:
"off" |
Parameter:
DataLoggingMaxPoints |
| Value: positive integer |
| Type: string | character vector |
Default:
"5000" |
Specify the sample time to use for logging the data for the selected signal. By
default, the logging sample time is inherited (-1) from the block
that produces the signal. For continuous logging sample time, specify the value as
0. To use a discrete sample time for logging data, specify the
sampling interval as a scalar.
Setting the sample time for a logged signal in the Signal Properties dialog box:
Separates design and testing because you do not need to insert a Rate Transition block to have a consistent sample time for logged signals
Reduces the amount of logged data for a continuous time signal, for which setting decimation is not relevant
Eliminates the need to post-process logged signal data for signals with different sample times
When you mark a signal for logging, the software inserts a hidden To Workspace block. When you specify a sample time for a logged signal, the software inserts a hidden Rate Transition block and a hidden To Workspace block.
Specifying a logging sample time may add a new sample time to the model. When you specify a logging sample time, the model calculates a value for the exact time hits. When you use a fixed-step solver, the logging sample time you specify must be a multiple of the base rate for the model.
Specifying a sample time for signal logging does not affect the simulation result. However, it is possible that the signal logging output for a logged signal varies depending on whether you specify a sample rate. For example, the interpolation method can differ depending on whether you specify a sample time for signal logging.
If you simulate in software-in-the-loop (SIL) mode, signal logging ignores the sample time you specify for logged signals.
Do not specify a sample time for:
Frame-based signals
Signals inside conditional subsystems or conditional referenced models
The Logging sample time property is the same as the Sample time property you configure using the Signal Properties dialog box.
Programmatic Use
To configure this option programmatically, use the set_param function to configure the
DataLoggingSampleTime parameter for the port handle that
corresponds to the block output port that produces the signal.
Parameter:
DataLoggingSampleTime |
| Value: numeric scalar |
| Type: string | character vector |
Default:
"-1" |
Specify how multidimensional data is logged and interpreted by the Simulation Data Inspector. By default, signals are logged as sample-based, with each element in a multidimensional sample treated as a channel.
When logging a frame-based signal, set Input processing to
Columns as channels (frame based). A frame-based signal
buffers a batch of samples to create a frame of data. When you log the data as
frame-based, each column in a sample is treated as a channel, and the row dimension is
treated as evenly-spaced samples within the channel.
You can also remove the buffering from a frame-based signal after simulation using the Simulation Data Inspector. For more information, see Convert Representation of Frame-Based Data.
Programmatic Use
To programmatically configure or access the Input processing
property for a logged signal, use the Simulink.sdi.setSignalInputProcessingMode function and the Simulink.sdi.getSignalInputProcessingMode function.
Complex signal data is logged as a single signal. Use the Complex format property to specify how to display a complex signal in the Simulation Data Inspector. By specifying the complex format in the Instrumentation Properties, you save the preference in the model so logged data is displayed consistently for each simulation. You can also modify the complex format for a signal in the Simulation Data Inspector, after data is logged from simulation or imported.
For all complex formats, you plot the complex signal as one signal. Some formats display components of the plotted signal as separate traces.
Real-Imaginary— Plot real and imaginary components as separate traces.The signal line color specifies the color of the real component. The imaginary component uses a different shade of the specified line color.
Magnitude-Phase— Plot magnitude and phase components as separate traces.The signal line color specifies the color of the magnitude component. The phase component uses a different shade of the specified line color.
Magnitude— Plot only the magnitude component.Phase— Plot only the phase component.
When you specify a value for the Subplots property, the signal is plotted on the corresponding subplot or subplots in the Simulation Data Inspector. You can use this property to save a plotting configuration in the model. However, the property does not affect the subplot layout in the Simulation Data Inspector or clear signals that are already plotted.
When you plot a signal on a subplot, the Simulation Data Inspector links the signal
to the subplot, and identifies the subplot with a number. As you move between subplot
layouts, the association between the signal and subplot persists, even if the shape or
visibility of the subplot changes. Subplots of Grid layouts follow
column-wise numbering, from 1 at the top left subplot to
8 in the bottom left, to 64 at the bottom right.
Basic Layouts subplots also use the fixed 8×8
column-wise numbering as a base. For more information, see Moving Between Subplot Layouts.
When enabled, you can configure the line style and color used to display the signal in the Simulation Data Inspector and on Dashboard Scope blocks and save the preference in the model so the signal is displayed consistently across MATLAB® sessions.
Specifying the line style and color in the model does not prevent you from changing the line style and color in the Simulation Data Inspector. The Dashboard Scope block and the Simulation Data Inspector always display a signal using the line style and color specified in the logged signal properties, as displayed in the Properties pane in the Simulation Data Inspector.
Set the line style, width, and color used to display the signal on Dashboard Scope blocks and in the Simulation Data Inspector.
Specifying the line style and color in the model does not prevent you from changing the line style and color in the Simulation Data Inspector. The Dashboard Scope block and the Simulation Data Inspector always display a signal using the line style and color specified in the logged signal properties, as displayed in the Properties pane in the Simulation Data Inspector.
Dependencies
To enable the Line property, select Custom style and color.
Data Access
When you enable this option, you can specify a data access callback function that processes or visualizes the logged signal data during simulation. The function receives data in packets asynchronously throughout the simulation, and the function executes each time it receives new data. For more information, see Access Data in MATLAB Function During Simulation.
Programmatic Use
To programmatically configure or access the Enable run-time data
access property for a logged signal, use the Simulink.sdi.setDataAccess function and the Simulink.sdi.getDataAccess function.
Name of the data access callback function that processes or visualizes signal data during simulation. The data access callback function always receives signal data as the first argument and can also receive simulation time and a function parameter as additional arguments. When the function receives all three arguments, simulation time is the second argument. For more information, see Access Data in MATLAB Function During Simulation.
For more information about writing MATLAB functions, see Create Functions in Files.
Dependencies
To enable the Function name property, select Enable run-time data access.
Programmatic Use
To programmatically configure or access the Function name
property for a logged signal, use the Simulink.sdi.setDataAccess function and the Simulink.sdi.getDataAccess function.
Option to send simulation time along with signal data to the data access callback function during simulation. The data access callback function always receives signal data as the first argument and can also receive simulation time and a function parameter as additional arguments. When a function receives all three arguments, simulation time is the second argument. For more information, see Access Data in MATLAB Function During Simulation.
Dependencies
To enable the Include simulation time property, select Enable run-time data access.
Programmatic Use
To programmatically configure or access the Include simulation
time property for a logged signal, use the Simulink.sdi.setDataAccess function and the Simulink.sdi.getDataAccess function.
When you specify a value for the Function parameter, the data access callback receives the specified value as a second or third argument depending on whether time is included with data sent to the callback function. When you use the same data access callback function to process data for more than one signal, specify a function parameter to identify which signal data the function receives in a given call. For more information, see Access Data in MATLAB Function During Simulation.
Dependencies
To enable the Function parameter property, select Enable run-time data access.
Programmatic Use
To programmatically configure or access the Function
parameter property for a logged signal, use the Simulink.sdi.setDataAccess function and the Simulink.sdi.getDataAccess function.
Version History
Introduced in R2018aUse the Data Access functionality in the Instrumentation Properties dialog box of a logged signal with fixed-point data to stream that data to a MATLAB callback function during simulation.
See Also
Tools
Functions
MATLAB Command
You clicked a link that corresponds to this MATLAB command:
Run the command by entering it in the MATLAB Command Window. Web browsers do not support MATLAB commands.
Select a Web Site
Choose a web site to get translated content where available and see local events and offers. Based on your location, we recommend that you select: .
You can also select a web site from the following list
How to Get Best Site Performance
Select the China site (in Chinese or English) for best site performance. Other MathWorks country sites are not optimized for visits from your location.
Americas
- América Latina (Español)
- Canada (English)
- United States (English)
Europe
- Belgium (English)
- Denmark (English)
- Deutschland (Deutsch)
- España (Español)
- Finland (English)
- France (Français)
- Ireland (English)
- Italia (Italiano)
- Luxembourg (English)
- Netherlands (English)
- Norway (English)
- Österreich (Deutsch)
- Portugal (English)
- Sweden (English)
- Switzerland
- United Kingdom (English)