Main Content

Horizontal Gauge

Display signal value during simulation on horizontal gauge with customizable appearance

Since R2020a

  • Horizontal Gauge block

Libraries:
Simulink / Dashboard / Customizable Blocks

Alternative Configurations of Horizontal Gauge Block:
Vertical Gauge

Description

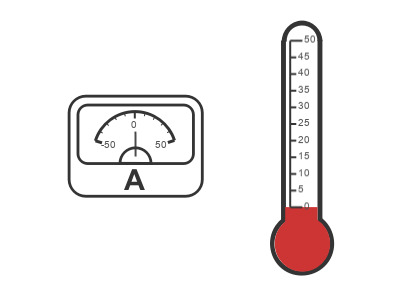
During simulation, the Horizontal Gauge block displays the value of the connected signal on a linear gauge that you can customize to look like a gauge in a real system. You can modify the range and tick values on the Horizontal Gauge block to fit your data. Use the Horizontal Gauge block with other dashboard blocks to build an interactive dashboard of controls and indicators for your model.

Customize Horizontal Gauge Blocks

When you add a Horizontal Gauge block to your model, the block is preconfigured with a default design. You can use the block with the default design or customize the appearance of the block.

To customize the appearance of the block, use design mode. After selecting the block, you can enter design mode in one of three ways:

  • On the block-specific tab, under Design, click Edit.

  • In the Property Inspector, on the Design tab, click Edit.

  • Pause on the ellipsis that appears over the block and click Edit Custom Block.

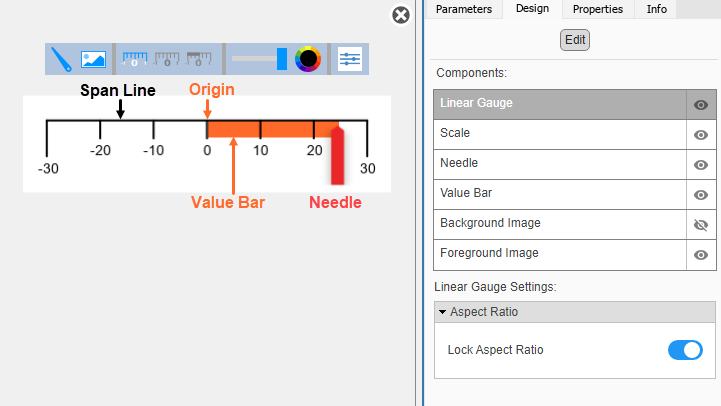
In design mode, you can use the toolbar above the block to customize the circular gauge. To access additional customization options or to enter exact values for design settings, use the Design tab in the Property Inspector.

Horizontal Gauge block in design mode with the toolbar and the Design tab in the Property Inspector visible.

Design Mode Actions

ActionAvailable in ToolbarAvailable in Design Tab

Upload a needle image.

YesYes

Upload a background image.

YesYes

Set a solid background color.

NoYes

Upload a foreground image.

NoYes

Specify the location of the origin from which the value bar grows.

NoYes

Change the color and opacity of the scale tick marks, scale labels, or value bar.

YesYes

Specify the scale direction as left to right or right to left.

NoYes

Change the size of the scale and needle.

NoYes

Change the position the scale and needle.

NoYes

To change the color and opacity of the scale tick marks, scale labels, or value bar using the toolbar, in the second section of the toolbar from the left, select the component whose color you want to change. To change the color, click the color wheel. To change the opacity, move the slider.

In addition to customizing the block design using the toolbar and Design tab, you can also resize and reposition components interactively in the canvas.

When you finish editing the design, to exit design mode, click the X in the upper right of the canvas.

Connect Dashboard Blocks

Dashboard blocks do not use ports to connect to model elements. To connect a dashboard block, use connect mode. To enter connect mode on an unconnected block, pause on the block you want to connect and click the Connect button . To enter connect mode on a connected block, select the block, pause on the ellipsis that appears (…), and in the action menu that expands, click the Connect button.

To connect a display block to a signal in your model or change the connection of a display block, enter connect mode. Select the signal line to which you want to connect. From the list that appears, select the signal to which you want to connect. Then, pause on the dashboard block and click the Done Connecting button . To see the dashboard block display the value of the connected block, run the simulation.

For more information about connecting dashboard blocks, see Connect Dashboard Blocks to Simulink Model.

You can also connect dashboard blocks to a Stateflow® chart. For more information, see Connect Dashboard Blocks to Stateflow (Stateflow).

This animation shows how to connect the Horizontal Gauge block to your model.

An unconnected Horizontal Gauge block connects to the signal that a Sine Wave block sends to an Outport block.

Limitations

  • Except for the Dashboard Scope block and the Display block, dashboard blocks can only connect to real scalar signals.

  • You cannot use the Connection table in the block dialog to connect a dashboard block to a block that is commented out. When you connect a dashboard block to a commented block using connect mode, the dashboard block does not display the connected value until the you uncomment the block.

  • Dashboard blocks cannot connect to model elements inside referenced models.

  • When you simulate a model hierarchy, dashboard blocks inside referenced models do not update.

  • Dashboard blocks do not support rapid accelerator simulation.

  • During simulation, you cannot connect a dashboard block to Stateflow chart data or state activity.

  • You cannot programmatically connect a dashboard block to Stateflow chart data or state activity.

  • Some signals do not have data available during simulation due to block reduction or optimization for accelerator mode simulations. To view such a signal using a dashboard block, mark the signal for logging.

Parameters

expand all

Use the Property Inspector and the Block Parameters dialog box to specify the values of the block parameters. To set the core parameters of the dashboard block, use the Block Parameters dialog box or the Parameters tab in the Property Inspector. To customize the block, use the Design tab in the Property Inspector. To open the Block Parameters dialog box for a block, double-click the block. To open the Property Inspector, on the Modeling tab, under Design, select Property Inspector.

Parameters

To set the core parameters of the dashboard block, open the Property Inspector and click the Parameters tab.

Signal

Dashboard blocks do not use ports to connect to model elements. To connect dashboard blocks to parameter values in your model, use connect mode, the Simulink® Toolstrip, or the Connection table in the Block Parameters dialog box. For information about connect mode and how to connect using the toolstrip, see Connect Dashboard Blocks to Simulink Model.

To connect a display block or change the connection of a display block using the Connection table:

  1. Select the block.

  2. To connect the block, in the Property Inspector, on the Parameters tab, click Connect. To change the connection of the block, click Change instead.

  3. Select the signal line to which you want to connect.

  4. In the table, select the signal to which you want to connect.

  5. Click Apply.

You can also connect dashboard blocks to a Stateflow chart. For more information, see Connect Dashboard Blocks to Stateflow (Stateflow).

Programmatic Use

Block Parameter: Binding
Type: Simulink.HMI.SignalSpecification
Default: []
Main

Finite, real, double, scalar value specifying the minimum tick mark value for the scale. The parameter value must be less than the value of the Maximum parameter.

Programmatic Use

To programmatically set the Minimum parameter, use a 1-by-3 vector containing values for the Minimum, Tick Interval, and Maximum parameters, in that order. To use the auto value for the Tick Interval, leave the Tick Interval position in the vector empty, or specify -1.

Block Parameter: Limits
Type: 1x3 vector
Default: [0 -1 100]

Finite, real, double, scalar value specifying the maximum tick mark value for the scale. The parameter value must be greater than the value of the Minimum parameter.

Programmatic Use

To programmatically set the Maximum parameter, use a 1-by-3 vector containing values for the Minimum, Tick Interval, and Maximum parameters, in that order. To use the auto value for the Tick Interval, leave the Tick Interval position in the vector empty, or specify -1.

Block Parameter: Limits
Type: 1x3 vector
Default: [0 -1 100]

Finite, real, positive, whole, scalar value specifying the interval of major tick marks on the scale. When set to auto, the block automatically adjusts the tick interval based on the values of the Maximum and Minimum parameters.

Programmatic Use

To programmatically set the Tick Interval parameter, use a 1-by-3 vector containing values for the Minimum, Tick Interval, and Maximum parameters, in that order. To use the auto value for the Tick Interval, leave the Tick Interval position in the vector empty, or specify -1.

Block Parameter: Limits
Type: 1x3 vector
Default: [0 -1 100]

Set the direction of increasing scale values.

Programmatic Use

Block Parameter: ScaleDirection
Type: character vector
Values: 'Clockwise' | 'Counterclockwise'
Default: 'Clockwise'

You can display the name of the element to which the dashboard block connects in a label positioned at the top or at the bottom of the block, or you can hide the label. If you want the label to be visible, specify the position of the block. If you do not want the label to be visible, specify Hide.

Note

When the dashboard block is not connected to an element, the label is blank.

Programmatic Use

Block Parameter: LabelPosition
Type: character vector
Values: 'Hide' | 'Bottom' | 'Top'
Default: 'Hide'

Select this parameter to maintain the aspect ratio when resizing the block in the Simulink canvas.

Tip

  • When the aspect ratio is locked, adding a new background image changes the aspect ratio of the block to match that of the background image.

  • When the aspect ratio is not locked, adding a new background image does not change the proportions of the block but instead stretches or scales the background image to fit the size of the block.

Color specifications for value ranges on the scale. Click the + button to add a scale color. For each color added, specify the minimum and maximum values of the range in which you want to display that color.

Programmatic Use

To programmatically specify the Scale Colors parameter, use an array of structures with these fields:

  • Min — Minimum value for the color range on the scale

  • Max — Maximum value for the color range on the scale

  • Color1-by-3 vector of double values between 0 and 1 that specify the color for the range in the form [r g b]

Include a structure in the array for each scale range for which you want to specify a color.

range1.Min = 0;
range1.Max = 10;
range1.Color = [0 0 1];
range2.Min = 10;
range2.Max = 15;
range2.Color = [0 1 0];
scaleRanges = [range1 range2];
Block Parameter: ScaleColors
Type: structure array
Default: 0x1 struct array

Design

To customize the dashboard block, open the Property Inspector, click the Design tab, and click Edit.

Linear Gauge

Select this parameter to maintain the aspect ratio when resizing the block in the Simulink canvas.

Tip

  • When the aspect ratio is locked, adding a new background image changes the aspect ratio of the block to match that of the background image.

  • When the aspect ratio is not locked, adding a new background image does not change the proportions of the block but instead stretches or scales the background image to fit the size of the block.

Scale

Finite, real, double, scalar value specifying the minimum tick mark value for the scale. The parameter value must be less than the value of the Maximum parameter.

Programmatic Use

To programmatically set the Minimum parameter, use a 1-by-3 vector containing values for the Minimum, Tick Interval, and Maximum parameters, in that order. To use the auto value for the Tick Interval, leave the Tick Interval position in the vector empty, or specify -1.

Block Parameter: Limits
Type: 1x3 vector
Default: [0 -1 100]

Finite, real, double, scalar value specifying the maximum tick mark value for the scale. The parameter value must be greater than the value of the Minimum parameter.

Programmatic Use

To programmatically set the Maximum parameter, use a 1-by-3 vector containing values for the Minimum, Tick Interval, and Maximum parameters, in that order. To use the auto value for the Tick Interval, leave the Tick Interval position in the vector empty, or specify -1.

Block Parameter: Limits
Type: 1x3 vector
Default: [0 -1 100]

Finite, real, positive, whole, scalar value specifying the interval of major tick marks on the scale. When set to auto, the block automatically adjusts the tick interval based on the values of the Maximum and Minimum parameters.

Programmatic Use

To programmatically set the Tick Interval parameter, use a 1-by-3 vector containing values for the Minimum, Tick Interval, and Maximum parameters, in that order. To use the auto value for the Tick Interval, leave the Tick Interval position in the vector empty, or specify -1.

Block Parameter: Limits
Type: 1x3 vector
Default: [0 -1 100]

Specify the value on the scale from which the needle moves and the value bar grows. When set to auto, the Origin is the minimum of the scale.

Example: 0

Set the direction of increasing scale values.

Programmatic Use

Block Parameter: ScaleDirection
Type: character vector
Values: 'Clockwise' | 'Counterclockwise'
Default: 'Clockwise'

Specify the horizontal offset of the left edge of the bounding box of the scale from the left edge of the block as a ratio of the block width. Relative to the position of the scale when the offset is 0, an offset with a negative value moves the scale left, and an offset with a positive value moves the scale right.

Example: 1

Specify the vertical offset of the top edge of the bounding box of the scale from the top edge of the block as a ratio of the block height. Relative to the position of the scale when the offset is 0, an offset with a negative value moves the scale up, and an offset with a positive value moves the scale down.

Example: 1

Specify the width of the bounding box of the scale as a ratio of the block width.

Example: 2

Specify the height of the bounding box of the scale as a ratio of the block height.

Example: 2

Select this parameter to maintain the aspect ratio when resizing the scale using the Property Inspector.

Set the color of the scale tick marks, the span line, and the block name. Choose a color from the palette of standard colors, or specify a custom color.

Tip

You can also set the Tick Color by choosing a Foreground Color on the Format tab of the Simulink Toolstrip.

To specify the color of the block text, use the Label Color parameter.

Programmatic Use

Specify the ForegroundColor parameter for the block as a string or a character vector that defines a 1-by-3 [r g b] vector with values between 0 and 1.

Block Parameter: ForegroundColor
Type: character vector | string
Values: [r g b] vector

Choose a font color for the scale label from the palette of standard colors, or specify a custom color.

Tip

To specify the color of the scale, use the Tick Color parameter.

Specify the vertical distance from the scale labels to the free end of their corresponding tick marks on the scale as a ratio of the height of the bounding box of the scale.

Example: 0.5

Needle

Specify the width of the needle image as a ratio of the block width.

Example: 1

Specify the height of the needle image as a ratio of the block height.

Example: 1

Select this parameter to maintain the aspect ratio when resizing the image using the Property Inspector.

Specify the horizontal offset of the needle image center from the scale origin as a ratio of the needle image width. Relative to the position of the needle image when the offset is 0, an offset with a negative value moves the image left, and an offset with a positive value moves the image right.

Example: 1

Specify the vertical offset of the top edge of the needle image from the span line of the scale as a ratio of the needle image height. Relative to the position of the needle image when the offset is 0, an offset with a negative value moves the image up, and an offset with a positive value moves the image down.

Example: 1

Value Bar

Specify the distance from the top edge of the value bar to the span line as a ratio of the height of the bounding box of the scale. Relative to the position of the value bar when the offset is 0, an offset with a negative value moves the value bar up, and an offset with a positive value moves the value bar down.

Example: 0.25

Specify the thickness of the value bar as a ratio of the height of the bounding box of the scale.

Example: 0.3

Background Image

For the block background, you can provide a background image or select a solid color. To select a solid background color, select this parameter. To provide a background image, clear this parameter.

Note

Changing the background color using the Format tab of the Simulink Toolstrip removes the background image and enables the Use Background Color parameter.

Example: on

To use a solid background color, select the Use Background Color parameter. Then, choose a background color from the palette of standard colors, or specify a custom color.

Tip

You can also specify the Background Color in the Format tab of the Simulink Toolstrip.

To specify the color of the block text, use the Font Color parameter.

Programmatic Use

Specify the BackgroundColor parameter for the block as a 1-by-3 [r g b] vector with values between 0 and 1 that is formatted as a string or a character vector.

Block Parameter: BackgroundColor
Type: string | character vector
Values: [r g b] vector

Specify the block background opacity as a scalar value from 0 to 1.

Example: 0.5

Specify the corner radius of the area covered by the block background color as a ratio of half of the smaller of the two block dimensions, width or height.

Example: 0.25

Foreground Image

Specify the horizontal offset of the left edge of the image from the left edge of the block as a ratio of the block width. Relative to the position of the image when the offset is 0, an offset with a negative value moves the image left, and an offset with a positive value moves the image right.

Example: 1

Specify the vertical offset of the top edge of the image from the top edge of the block as a ratio of the block height. Relative to the position of the image when the offset is 0, an offset with a negative value moves the image up, and a positive value moves the image down.

Example: 1

Specify the image width as a ratio of the block width.

Example: 0.5

Specify the image height as a ratio of the block height.

Example: 0.5

Select this parameter to maintain the aspect ratio when resizing the image using the Property Inspector.

Block Characteristics

Data Types

Boolean | double | enumerated | fixed point | half | integer | single

Direct Feedthrough

no

Multidimensional Signals

no

Variable-Size Signals

no

Zero-Crossing Detection

no

Alternative Configurations

expand all

The Vertical Gauge block displays signal value during simulation on vertical gauge with customizable appearance.

To convert a horizontal gauge to a vertical gauge, select the Horizontal Gauge block and press Ctrl+R (on macOS, press command+R instead).

Note

If the Horizontal Gauge block has a foreground or background image that is not symmetrical about the horizontal axis of the image, after rotating the block, you may need to replace the image with a copy of the image that is mirrored about the vertical axis.

Libraries:
Simulink / Dashboard / Customizable Blocks

Extended Capabilities

Version History

Introduced in R2020a

expand all