Model Voltage Hysteresis in Battery
This example shows how to simulate the voltage hysteresis phenomena in rechargeable batteries by using the Battery Equivalent Circuit block. The open-circuit voltage (OCV) is the difference in measured voltage between the battery terminals when the current flow is equal to zero. The OCV is the electromotive force or the rest potential. For rechargeable or secondary batteries such as lithium-ion batteries, the OCV at a given state of charge and temperature state depends on whether you previously charged or discharged the battery. In lithium-ion cells with conventional intercalation electrodes, this discrepancy is typically explained by the presence of different solid phases in the electrode active material, reaction path hysteresis, and related thermodynamic effects. The lithiation and delithiation of an electrode active material during the charge and discharge processes often produce different electrode solid phases at different states of charge depending on battery chemistry.
The presence and coexistence of different solid phases with different lattice constants at the electrode particle surface can cause mechanical stress at the phase boundaries. This boundary essentially acts as an extra path resistance to the current flow and, to overcome this barrier, an overpotential naturally develops. These phase boundaries at the electrode/electrolyte interface depend on whether the battery was discharging (lithiation of cathode) or charging (lithiation of anode). On the other hand, reaction path hysteresis occurs due to different or asymmetrical reaction pathways that must be activated for a charge or a discharge process to occur. Van der Ven et al. [1] provides a good introduction into the subject of hysteresis.
The Battery Equivalent Circuit block implements the one-state hysteresis model from Gregory Plett [2], which dynamically models the load path-dependent variation in the open-circuit voltage that occurs in battery active materials. The application and data in this example are based on a lithium-ion iron phosphate (LFP) battery which consists of a two-phase cathode active material [3]. This figure shows the Battery Equivalent Circuit block mask and the parameters of the voltage hysteresis model.

Open Model
Open the cellHysteresis model.
modelName = 'cellHysteresis';
open_system(modelName);
Simulate Cell with no Active Hysteresis Model
If the hysteresis model is not active, the Battery Equivalent Circuit block uses the value of the Open-circuit voltage, OCV (SOC) parameter during the simulation. The open-circuit voltage is typically the average between the charge and discharge open-circuit voltages. To improve the simulation accuracy, you can define the open-circuit voltage depending on the load case. To measure the charge open-circuit voltage, you normally perform a charge-only potentiometric experiment, or galvanostatic intermittent titration technique (GITT). During a GITT, you charge the battery cell to a given state of charge and then you allow the battery to rest at zero current over a period of time. Therefore, the charge OCV is measured only after a previous charge step with its associated voltage relaxation time. Conversely, you measure the discharge open-circuit voltage exclusively after a discharge step in a discharge-only experiment.
If you do not select an active hysteresis model, the OCV always stays the same whether you charge or discharge the battery cell. Run a simulation without the hysteresis and plot the behavior of the open-circuit voltage. To setup the simulation, ensure that the hysteresis model is not active.
set_param([modelName,'/Cell'],'HysteresisModel','simscape.battery.enum.cells.HysteresisModel.none');
Additionally, the initial condition for hysteresis must not be active either.
set_param([modelName,'/Cell'],'hysteresisState_specify','off');
Simulate a full charge and discharge cycle with 1C.
hysteresisSimout = sim(modelName);
Plot the results.
cellNoHysteresisPlot(hysteresisSimout,socVec,hysteresisChargeVoltage,hysteresisDischargeVoltage);
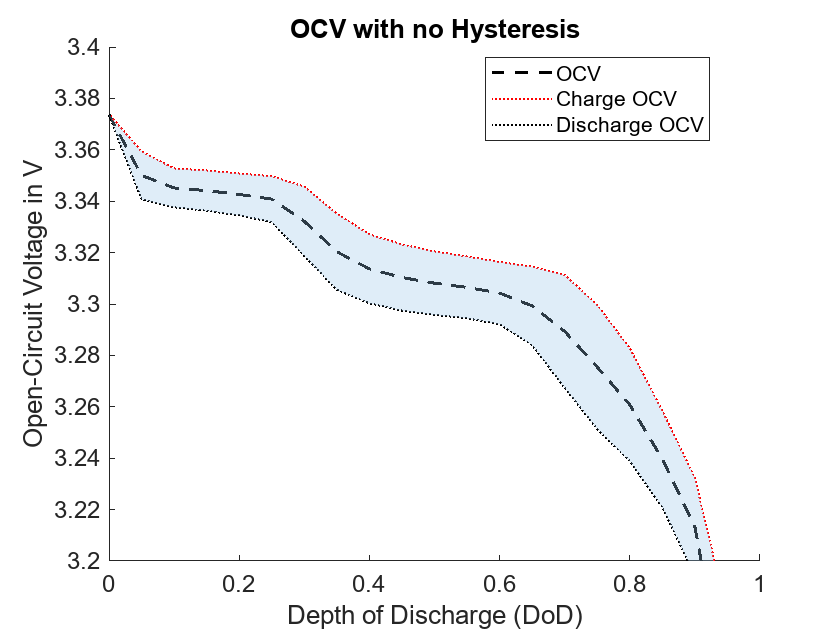
The light blue surface represents the area where hysteresis occurs. The upper and lower limits of the surface represent the charge OCV and the discharge OCV. The upper limit (red dotted line) is the maximum dynamic hysteresis voltage when charging. The lower limit (black dotted line) is the maximum dynamic hysteresis voltage when discharging. The black line shows the OCV of the battery model which is the average between charge and discharge OCV.
Although the model performs a full charge followed by a full discharge, the OCV of the cell always remains on the same line since the hysteresis model is not active. Depending on the required model accuracy, using the average OCV might not yield satisfactory results.
Simulate Cell with Active Hysteresis Model
Now run a simulation by activating the simplest hysteresis model. Set the Hysteresis model parameter of the Battery Equivalent Circuit block to oneStateModel.
set_param([modelName,'/Cell'],'HysteresisModel','simscape.battery.enum.cells.HysteresisModel.oneStateModel');
This hysteresis model implements a first-order model for the OCV of the cell. The block calculates the new OCV of the cell by using this equation,
,
whereaccounts for the cell hysteresis:
.
Since no thermal model is currently active for the cell, the maximum dynamic hysteresis voltage depends only on the SOC. The maximumDynamicHysteresisVoltage(SOC) term in the equation is equal to half the difference between the charge and discharge OCV curves:
.
The hysteresisState term describes the memory effect of the cell hysteresis.
A
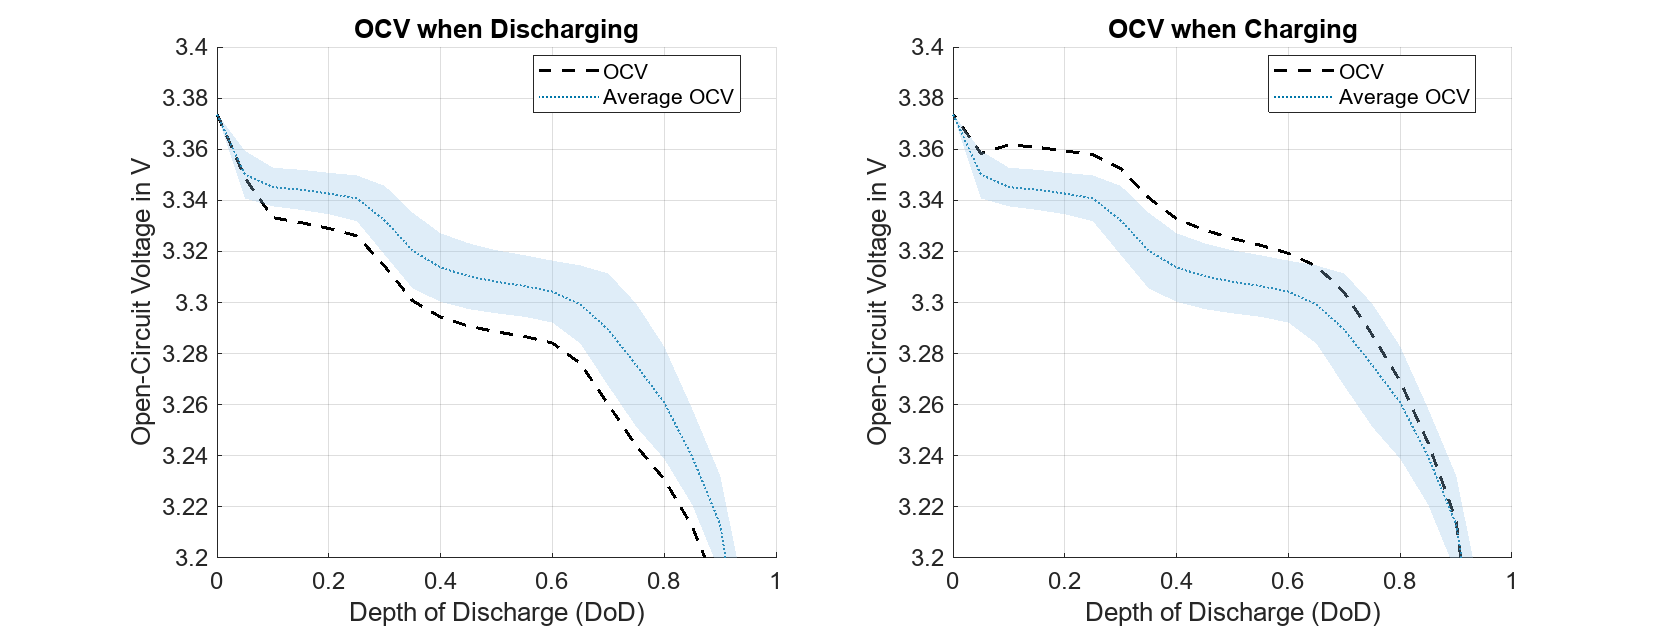
hysteresisStateof -1 means that the OCV used by the cell model is read from the discharge OCV curve, which is represented by the blue dotted curve in the previous plot.A
hysteresisStateof 0 means that the OCV used by the cell model is read from the mean OCV.A
hysteresisStateof 1 means that the OCV used by the cell model is read from the charge OCV curve, which is represented by the red dotted curve in the previous plot.
hysteresisState is equal to this first-order characteristic equation,
,
where is the current cell capacity, in ampere-hour, and is the cell current and rateHysteresis is a constant that determines how fast the value of hysteresisState converges. The bigger rateHysteresis, the quicker the convergence.
If the cell is charging, the value of the hysteresisState converges towards 1 and the charge OCV curve. If the cell is discharging, the value of hysteresisState converges towards -1 and the discharge OCV curve. If the current across the cell goes to zero, hysteresisState assumes the last value when the cell was either charging or discharging.
Assign the initial conditions for the hysteresis model by specifying the initial value of hysteresisState. First, activate the initial condition by setting the property hysteresisState_specify to "on".
set_param([modelName,'/Cell'],'hysteresisState_specify','on');
In this example, the initial value of hysteresisState is set to 0. Therefore, the initial OCV for the cell is equal to the mean OCV.
set_param([modelName,'/Cell'],'hysteresisState','0');
To ensure that the initial condition is fulfilled, set the hysteresisState_priority property to "High".
set_param([modelName,'/Cell'],'hysteresisState_priority','High');
Set the value of the Hysteresis Rate, HysteresisRate(SOC) parameter to 3.
simulationInput = Simulink.SimulationInput(modelName);
simulationInput = simulationInput.setVariable("rateHysteresis",3);
Disable the instantaneous hysteresis voltage by setting the Instantaneous hysteresis voltage, InstantaneousHysteresisVoltage(SOC) parameter to 0.
simulationInput = simulationInput.setVariable("instantaneousHysteresisVoltage",zeros(21,1));Simulate the model with a full charge and discharge cycle with 1C.
activeHysteresisSimout = sim(simulationInput);
Plot the results.
cellHysteresisPlot(activeHysteresisSimout,socVec,hysteresisChargeVoltage,hysteresisDischargeVoltage,ocvVec);

The OCV starts at a depth of discharge (DOD) of 0 on the blue dotted line, which is the mean OCV. In the subsequent discharging phase, the OCV converges towards the hysteresis voltage discharge curve. When the approaches the value of 1, a charging procedure starts. You can observe the hysteresis in the OCV because the OCV does not reach the charge hysteresis curve until the cell is fully recharged.
Simulate Cell with Active Hysteresis Model and Higher Hysteresis Rate
To highlight the impact of the value of the hysteresis rate on the OCV, double the value of the Hysteresis rate, HysteresisRate(SOC) parameter.
simulationInput = simulationInput.setVariable("rateHysteresis",6);Disable the instantaneous hysteresis voltage by setting the Instantaneous hysteresis voltage, InstantaneousHysteresisVoltage(SOC) parameter to 0.
simulationInput = simulationInput.setVariable("instantaneousHysteresisVoltage",zeros(21,1));Simulate the model.
highHysteresisSimout = sim(simulationInput);
Plot the results.
cellHysteresisPlot(highHysteresisSimout,socVec,hysteresisChargeVoltage,hysteresisDischargeVoltage,ocvVec);

The convergence to the discharge and charge hysteresis curves occurs much faster because you doubled the hysteresis rate.
Simulate Cell with Active Hysteresis Model and Instantaneous Hysteresis
You can extend the hysteresis model by adding an instantaneous hysteresis component. To specify the instantaneous hysteresis, set the Instantaneous hysteresis voltage, InstantaneousHysteresisVoltage(SOC) parameter accordingly. If you enabled a thermal model for the battery cell, set the Instantaneous hysteresis voltage, InstantaneousHysteresisVoltageThermal(SOC,T) parameter instead. In this example, you set the instantaneous voltage drop to 10 mV regardless of the SOC value. For very low or very high SOC values, the instantaneous voltage drop is zero:
simulationInput = simulationInput.setVariable("instantaneousHysteresisVoltage",[0;0;ones(17,1)*0.01;0;0]);To calculate the hysteresis voltage, the Battery Equivalent Circuit block uses this equation:
.
The instantaneousHysteresisVoltage(SOC) term introduces an instantaneous component to the hysteresis response. Set the rateHysteresis value back to the original value of 3.
simulationInput = simulationInput.setVariable("rateHysteresis",3);Simulate the model to observe the effect of the instantaneous hysteresis component.
instantaneousHysteresisSimout = sim(simulationInput);
Plot the results.
cellHysteresisPlot(instantaneousHysteresisSimout,socVec,hysteresisChargeVoltage,hysteresisDischargeVoltage,ocvVec);
The instantaneous hysteresis voltage occurs much faster than the relatively slower dynamic hysteresis of the previous simulations. Note that the summation of the individual dynamic and instantaneous hysteresis factors can exceed the maximum dynamic hysteresis voltage.
References
Van der Ven, Anton, Kimberly A. See, and Laurent Pilon. 2022. “Hysteresis in Electrochemical Systems”. Battery Energy 1 (2): Art. No. 20210017.
Plett, G. L. (2015). Battery Management Systems: Volume I, Battery Modeling. United Kingdom: Artech House.
F. Baronti, N. Femia, R. Saletti and W. Zamboni, "Comparing open-circuit voltage hysteresis models for lithium-iron-phosphate batteries" IECON 2014 - 40th Annual Conference of the IEEE Industrial Electronics Society, Dallas, TX, USA, 2014, pp. 5635-5640, doi: 10.1109/IECON.2014.7049363.