Analyze Performance of Vanadium Redox Flow Battery
This example shows how to model a vanadium redox flow battery (VRFB), calculate the state of charge (SOC), and assess the impact of electrolyte flow rate on the performance of the battery.
Build VFRB Model
VRFBs are gaining popularity in energy storage for grid applications thanks to their long life, easy maintenance, and low adverse impact on the environment. In this example, you model the VRFB by solving ordinary differential equations (ODEs) and using Simscape™ custom components. To determine the battery performance, you compute the material balance equations for the four vanadium species in the electrolyte tank and in the cell stack. An equivalent circuit model describes the battery electrical response.
Define Mathematical Model
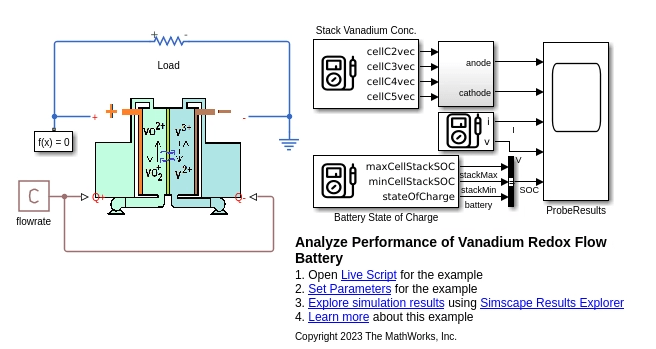
This figure shows a schematic of the VRFB. The battery comprises a cell stack of series-connected cells and an electrolyte that is replenished from the large electrolyte tanks. The battery stack and its pump system are installed over the two electrolyte storage tanks. In a VRFB, the vanadium exists in four different valence states. During the change of state of vanadium ions at the electrodes, the cell stack releases electrons that flow through an external circuit. These electrons constitute the DC current in the circuit. To increase the battery capacity, increase the size of the electrolyte tank. To increase the battery power, increase the number of cells in the battery stack.

This electrochemical reaction defines the reactions at the cathode:
.
This electrochemical reaction defines the reactions at the anode:
.
This equation describes the mass balance for the four vanadium species in the cell stack:
where:
represents the four different vanadium species (valence states of 2, 3, 4, and 5).
and represent vanadium species concentration in the cell stack and electrolyte tank, respectively.
is the current.
is the electrolyte flow rate.
is the number of series-connected cells in the stack.
is the single-cell volume.
is the area of the cell membrane.
is the thickness of the cell membrane.
is the diffusivity of the vanadium species through the membrane.
The sign before the term is positive for the vanadium species 2 and 5 and negative for vanadium species 3 and 4. is equal to 1 in this case. The left-hand side (LHS) of the equation describes the rate of change of species concentration in the cell with time. The first term on the right-hand side (RHS) of the equation represents the species concentration changes due to electrolyte flow. The second term on the RHS denotes the flow of charge. The third term on the RHS represents the vanadium species migration across the membrane as a function of the diffusivity and the species concentrations [1,2].
This equation describes the mass balance for the four vanadium species in the electrolyte tank:
where:
represents the four different vanadium species (valance states of 2, 3, 4, and 5).
and represent vanadium species concentration in the cell stack and electrolyte tank, respectively.
is the electrolyte flow rate.
is the electrolyte tank volume.
A resistor-capacitor-pair-based (RC-pair-based) equivalent circuit model represents the cell electrical dynamics.
This equation defines the cell open-circuit potential:
where:
represents the electrode potential, which is given by this relationship: .
is the universal gas constant.
is the temperature of the battery.
is the Faraday's constant.
is equal to 1.
Build Custom Component
The custom component in the vanadiumRedoxFlowBattery SSC file implements the mathematical model. The variables for the cell stack and the electrolyte tank have the prefixes cell and tank, respectively. The cell stack concentration is a vector with a length equal to the number of series-connected cells. Each cell can experience a different electrolyte flow rate that depends on the hydraulics. The Flow maldistribution to positive half cell and Flow maldistribution to negative half cell parameters define the electrolyte flow rate on each cell in the stack. The tank concentration is a scalar value, specified in cubic meters. The SOC is based on the species concentration in the electrolyte tanks.
The custom component has one positive electrical node and one negative electrical node. The custom component also takes the pump flow rate as input. You can specify the flow rates for the positive and the negative half-cells. If the flow rate is low, the cell stack depletes all its vanadium species quickly, even if the electrolyte tank has sufficient active mass. Hence, you must specify a reasonable flow rate for the electrolyte.
You can visualize all the variables, including the different species concentrations and the battery SOC, by using a Probe block. The battery equivalent circuit model determines the battery voltage using this code:
voltNernstEqn == V0 + (R*temperature/F)*log(SOCp*SOCn/((1-SOCp)*(1-SOCn)));
voltOhmic == i*ecmR0;
i*ecmR1 == ecmTau1*voltDynamic.der + voltDynamic;
v == Ns*voltNernstEqn + voltOhmic + voltDynamic;
Here, v is the battery voltage, which is equal to the sum of the open-circuit potential of the Nernst equation, voltNernstEqn, the voltage drop due to the ohmic resistance, voltOhmic, and the voltage drop across the RC pair, voltDynamic.
Configure Model
The VRFBperformanceAnalysis SLX file shows the VRFB custom component connected to a resistor that models a simple load. The flow rate block defines the constant flow rate for both pumps.
The vrfbPerformanceAnalysisParams.m file defines the parameters for the VRFB model. To change the model parameters, at the MATLAB® Command Window, enter this command:
edit vrfbPerformanceAnalysisParams.m
The flowrate_lpm parameter defines the constant input flow rate of the electrolyte in the battery. The battery comprises 10 cells in series. To determine the number of series-connected cells in the battery, query the Ns field of the elec structure using dot notation (elec.Ns). The chem and hydr structures define the chemistry and hydraulics parameters, respectively, for the battery. This example uses an electrolyte with a vanadium concentration of 2M. The hydr.FlowMalDistrPos and hydr.FlowMalDistrPos parameters are unity vectors that indicate no flow maldistribution along the battery stack.
Set Model Parameters
Electrical
elec.Ns — Number of series-connected cells in the battery stack, specified as a positive integer.
elec.V0 — Single-cell electrode potential, in volt, specified as a scalar.
elec.R0 — Battery ohmic resistance, in ohm, specified as a scalar.
elec.R1 — Battery RC pair resistance, in ohm, specified as a scalar.
elec.Tau1 — Battery RC pair time constant, in seconds, specified as a scalar.
elec.SOC — Initial battery SOC, specified as a scalar in the range [0,1].
Chemistry
chem.Len — Length of the porous electrode, in meters, specified as a positive scalar.
chem.Wid — Width of the porous electrode, in meters, specified as a positive scalar.
chem.Thk — Thickness of the porous electrode, in meters, specified as a positive scalar.
chem.Por — Electrode porosity, specified as a scalar in the range [0,1].
chem.Mem — Membrane thickness, in meters, specified as a positive scalar.
chem.M — Vanadium molarity in the electrolyte solution, in mol/liter, specified as a scalar.
chem.D2, D3, D4, D5 — Vanadium species , , , diffusivity through the membrane, in /s, specified as a scalar value.
Hydraulics
hydr.TankVol — Tank volume, in , specified as a positive scalar.
hydr.FlowMalDistrPos — Flow maldistribution along the stack for electrolyte flow into the positive electrode, specified as a vector with a length equal to the number of cells in the battery stack.
hydr.FlowMalDistrNeg — Flow maldistribution along the stack for electrolyte flow into the negative electrode, specified as a vector with a length equal to the number of cells in the battery stack.
This example models uniform flow through all the cells in the stack. To model an example of flow maldistribution, at the MATLAB® Command Window, enter these commands:
elec.Ns = 10;
hydr.FlowMalDistrPos = [1.04 1.03 1.02 1.01 1.00 1.00 0.99 0.98 0.97 0.96];
hydr.FlowMalDistrNeg = hydr.FlowMalDistrPos;
Thermal
temperature — Temperature at which the battery operates, in Kelvin, specified as a positive scalar.
The flowrate_lpm and systemLoad parameters define the electrolyte flow rate in liters per minute (LPM) and the external resistance for system load in ohm, respectively.
Run Model
Set the initial SOC of the battery, elec.SOC, to 1. Set the model parameters.
run("vrfbPerformanceAnalysisParams.m");Define the number of cells in the stack.
elec.Ns = 10;
Define the constant flow rate values at which the battery needs to be evaluated.
flowrateVec = [0 0.5 1 15 30];
Run the simulation for all the flow rate values.
numCase = length(flowrateVec);
simRes  = cell(1,numCase);
for itr = 1:numCase
    flowrate_lpm = flowrateVec(1,itr);
    sim("VRFBperformanceAnalysis.slx");
    simRes{1,itr} = simlog_vrfbResults;
end
Plot Simulation Results
Plot the current, voltage, and SOC of the VRFB at a range of flow rates. At no flow conditions (0 LPM flow rate), the battery provides current until the active materials in the cell stack react to release the electrons. Once the cell stack concentration depletes, the current flow stops even if the tank still contains active material, as indicated by the battery SOC. As the flow rate increases, the rate of reactants decrease in the cell stack is offset by the fresh reactants coming in with the electrolyte from the tank. In this example, 15 LPM is a reasonable flow rate to maintain so that the stack reactants decrease at a rate that is consistent with the overall battery SOC or the tank reactant ratio.
for itr = 1:numCase
    vrfbPlotAnalysisResults(simRes{1,itr});
end


Reference
[1] Li, Yifeng, Maria Skyllas-Kazacos, and Jie Bao. “A Dynamic Plug Flow Reactor Model for a Vanadium Redox Flow Battery Cell.” Journal of Power Sources 311 (April 2016): 57–67. https://doi.org/10.1016/j.jpowsour.2016.02.018
[2] Khaki, Bahman, and Pritam Das. “An Equivalent Circuit Model for Vanadium Redox Batteries via Hybrid Extended Kalman Filter and Particle Filter Methods.” Journal of Energy Storage 39 (July 2021): 102587. https://doi.org/10.1016/j.est.2021.102587