Main Content

SimBiology.SensitivityAnalysisOptions

Specify sensitivity analysis options for SimBiology models

Description

This object contains options for local sensitivity analysis. The object is a property of a SimBiology.Configset object.

Local sensitivity analysis is supported only for deterministic (ODE) simulations. To enable or disable local sensitivity analysis, use the SensitivityAnalysis property.

You can add a number of configuration set objects with different SensitivityAnalysisOptions to the model object with the addconfigset method. Only one configuration set object in the model object can have the Active property set to true at any given time.

Creation

Use addconfigset or getconfigset to get a configset object of a SimBiology model first. Then use dot notation configsetObj.SensitivityAnalysisOptions to get the options object.

Properties

expand all

Sensitivity inputs with respect to which you want to compute the sensitivities of species or parameter states in your model, specified as a SimBiology.Species, SimBiology.Parameter, SimBiology.Compartment, or array of such objects.

SimBiology® calculates sensitivities with respect to the values of parameters, compartments, and species specified in the Inputs property. When you simulate a model with SensitivityAnalysis enabled in the active configset object, sensitivity analysis returns the computed sensitivities of the species and parameters specified in the Outputs property.

Note

  • If a species, parameter, or compartment is determined by a repeated assignment rule, then you cannot use it as a sensitivity input.

  • To be a sensitivity input, a compartment must have a constant capacity, that is, its Constant property must be set to true.

  • If a parameter is referenced by the LagParameterName or DurationParameterName property of a SimBiology.RepeatDose, the parameter must be constant to be an input for sensitivity analysis.

  • If a parameter is referenced by any other SimBiology.RepeatDose properties, namely, Amount, Rate, Interval, StartTime, and RepeatCount, you cannot use the parameter as an input for sensitivity analysis.

  • If you have any species, parameter, or compartment affecting a parameterized RepeatDose or ScheduleDose object, directly or indirectly via a rule, you cannot use such a quantity as an input for sensitivity analysis.

  • The sensitivities are zero for any sensitivity input that is determined by an initial assignment.

Sensitivity outputs, specified as a SimBiology.Species, SimBiology.Parameter, or array of such objects. The property defines species and parameter states that you want to compute sensitivities for.

SimBiology calculates sensitivities with respect to the values of the parameters and the initial amounts of the species specified in the Inputs property. When you simulate a model with SensitivityAnalysis enabled in the active SimBiology.configset object, sensitivity analysis returns the computed sensitivities of the species and parameters specified in the Outputs property.

Note

If a species or parameter is determined by a repeated assignment rule, then you cannot use it as a sensitivity output.

Normalization type for local sensitivity analysis, specified as "None", "Half", or "Full".

The following equations show you how sensitivities of a species x with respect to an input parameter k are calculated for each normalization type. In each equation, the numerator is a sensitivity output and the denominator is a sensitivity input.

  • "Full" specifies that the data should be made dimensionless.

    (kx(t))(x(t)k)

    Use this option if you want to compute the relative change in a sensitivity output, x(t), with respect to the relative change in a sensitivity input, k. This option is useful to compare different sensitivities where the respective sensitivity inputs have different units and respective sensitivity outputs have different units as well.

  • "Half" specifies normalization relative to the numerator (sensitivity output) only.

    (1x(t))(x(t)k)

    Use this option if you want to compute the relative change in a sensitivity output, x(t), with respect to the absolute change in a sensitivity input, k. This option is useful to compare different sensitivities when the sensitivity outputs have different units while the inputs have the same units.

  • "None" specifies no normalization.

    x(t)k

    Use this option if you want to compute the absolute change in a sensitivity output, x(t), with respect to the absolute change in a sensitivity input, k. This option is useful to compare different sensitivities when all sensitivity inputs have the same units and all sensitivity outputs have the same units.

Tip

Intuitively, you might want to normalize even if the units are the same when the inputs and/or outputs are at very different scales. For instance, one species might have a concentration of around 1 mM while another has a concentration around 100 mM. Using the full normalization lets you compare the relative (percentage) change, such as 1%, to both sensitivity inputs and outputs. However, if you want to compare the sensitivities of an absolute change, such as 0.1 nM, to both inputs and outputs, use no normalization.

Data Types: char | string

Examples

collapse all

This example performs local sensitivity analysis on a Model of the Yeast Heterotrimeric G Protein Cycle to find parameters that influence the amount of active G protein. Assume that you are calculating the sensitivity of species Ga with respect to every parameter in the model. Thus, you want to calculate the time-dependent derivatives:

(Ga)(kRLm),(Ga)(kRL),(Ga)(kG1),(Ga)(kGa)...

Load G-protein Model

The provided SimBiology project gprotein_norules.sbproj contains a model that represents the wild-type strain (stored in variable m1).

sbioloadproject gprotein_norules.sbproj m1

Set up Sensitivity Analysis Options

The options for sensitivity analysis are in the configset object of the model.

csObj = getconfigset(m1);

Use the sbioselect function, which lets you query by type, to retrieve the Ga species from the model.

Ga = sbioselect(m1,'Name','Ga');

Set the Outputs property of the SensitivityAnalysisOptions object to the Ga species.

csObj.SensitivityAnalysisOptions.Outputs = Ga;

Retrieve all the parameters from the model and store the vector in a variable, pif.

pif = sbioselect(m1,'Type','parameter');

Set the Inputs property of the SensitivityAnalysisOptions object to the pif variable containing the parameters.

csObj.SensitivityAnalysisOptions.Inputs =  pif;

Enable sensitivity analysis in the configset object by setting the SensitivityAnalysis option to true.

csObj.SolverOptions.SensitivityAnalysis = true;

Set the Normalization property of the SensitivityAnalysisOptions object to perform 'Full' normalization.

csObj.SensitivityAnalysisOptions.Normalization = 'Full';

Calculate Sensitivities

Simulate the model and return the data to a SimData object:

simDataObj = sbiosimulate(m1);

Extract and Plot Sensitivity Data

You can extract sensitivity results using the getsensmatrix method of a SimData object. In this example, R is the sensitivity of the species Ga with respect to eight parameters. This example shows how to compare the variation of sensitivity of Ga with respect to various parameters, and find the parameters that affect Ga the most.

[T, R, snames, ifacs] = getsensmatrix(simDataObj);

Because R is a 3-D array with dimensions corresponding to times, output factors, and input factors, reshape R into columns of input factors to facilitate visualization and plotting:

R2 = squeeze(R);

After extracting the data and reshaping the matrix, plot the data:

figure;
plot(T,R2);
title('Normalized Sensitivity of Ga With Respect To Various Parameters');
xlabel('Time (seconds)');
ylabel('Normalized Sensitivity of Ga');
leg = legend(ifacs, 'Location', 'NorthEastOutside');
set(leg, 'Interpreter', 'none');

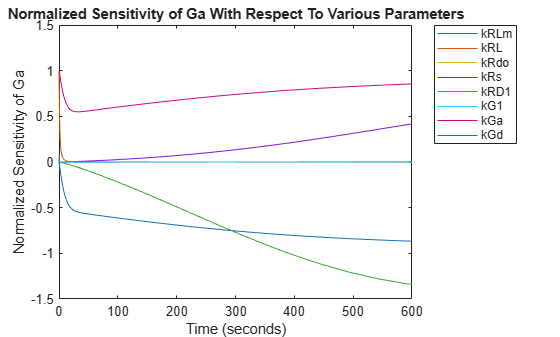
From the plot you can see that Ga is most sensitive to parameters kGd, kRs, kRD1, and kGa. This suggests that the amounts of active G protein in the cell depends on the rate of:

  • Receptor synthesis

  • Degradation of the receptor-ligand complex

  • G protein activation

  • G protein inactivation

Version History

Introduced in R2006a