plot
Plot confidence interval results for model predictions
Syntax
Description
plots confidence interval results from fh
= plot(predCI
)predCI
, a PredictionConfidenceInterval
object or vector of objects.
The function plots the observation data points as black plus signs and the model predictions as solid lines.
If the status of confidence interval (
predCI
.Status) isconstrained
ornot estimable
, the function uses the second default color (red) to plot the confidence intervals.Otherwise, the function uses the first default color (blue) and plots the confidence intervals as shaded areas.
Examples
Plot Confidence Intervals of PK Model Predictions
Load Data
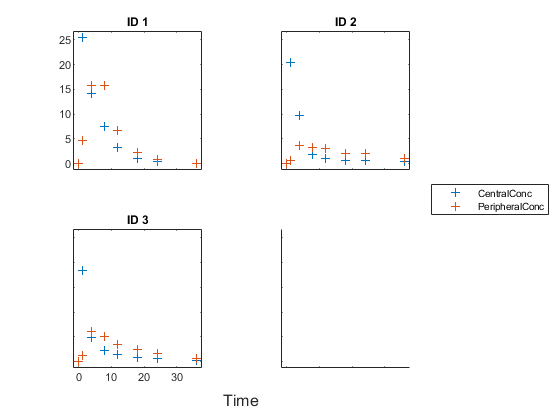
Load the sample data to fit.
load data10_32R.mat gData = groupedData(data); gData.Properties.VariableUnits = {'','hour','milligram/liter','milligram/liter'}; sbiotrellis(gData,'ID','Time',{'CentralConc','PeripheralConc'},'Marker','+',... 'LineStyle','none');
Create Model
Create a two-compartment model.
pkmd = PKModelDesign; pkc1 = addCompartment(pkmd,'Central'); pkc1.DosingType = 'Infusion'; pkc1.EliminationType = 'linear-clearance'; pkc1.HasResponseVariable = true; pkc2 = addCompartment(pkmd,'Peripheral'); model = construct(pkmd); configset = getconfigset(model); configset.CompileOptions.UnitConversion = true;
Define Dosing
Define the infusion dose.
dose = sbiodose('dose','TargetName','Drug_Central'); dose.StartTime = 0; dose.Amount = 100; dose.Rate = 50; dose.AmountUnits = 'milligram'; dose.TimeUnits = 'hour'; dose.RateUnits = 'milligram/hour';
Define Parameters
Define parameters to estimate.
responseMap = {'Drug_Central = CentralConc','Drug_Peripheral = PeripheralConc'}; paramsToEstimate = {'log(Central)','log(Peripheral)','Q12','Cl_Central'}; estimatedParam = estimatedInfo(paramsToEstimate,... 'InitialValue',[1 1 1 1],... 'Bounds',[0.1 3;0.1 10;0 10;0.1 2]);
Fit Model
Perform an unpooled fit, that is, one set of estimated parameters for each patient.
unpooledFit = sbiofit(model,gData,responseMap,estimatedParam,dose,'Pooled',false);
Compute Confidence Intervals for Model Predictions
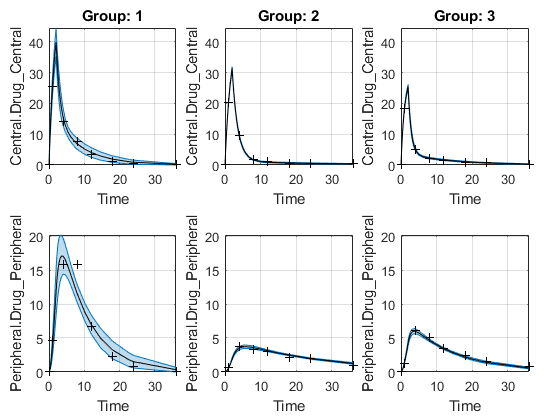
Compute 95% confidence intervals for predicted model responses in the unpooled fit using the Gaussian approximation.
ciPredUnpooled = sbiopredictionci(unpooledFit);
Plot the confidence intervals. If the estimation status of a confidence interval is constrained
or not estimable
, the function uses the second default color (red). Otherwise, the function uses the first default color (blue). To see the color order, type get(groot,'defaultAxesColorOrder')
.
Each group is displayed in each column, from left to right, in the same order that they appear in the GroupNames
property of the object, which is used to label each column.
plot(ciPredUnpooled)
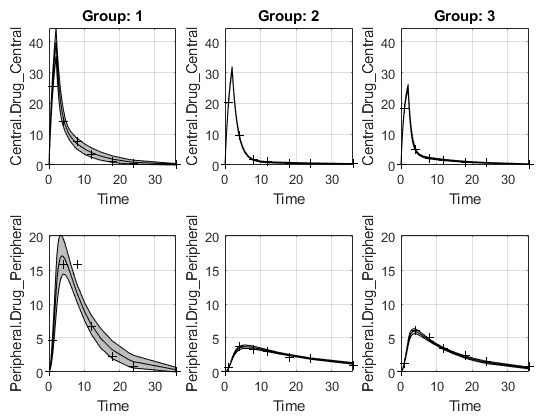
Plot using a single color (black).
plot(ciPredUnpooled,'Color',[0 0 0])
Input Arguments
predCI
— Confidence interval results for model predictions
PredictionConfidenceInterval
object | vector
Confidence interval results for model predictions, specified as a PredictionConfidenceInterval
object or a vector of
objects.
If there are multiple groups, each group is displayed in each column, from
left to right, in the same order that they appear in the
GroupNames
property of the object. Each row
represents a model response.
Name-Value Arguments
Specify optional pairs of arguments as
Name1=Value1,...,NameN=ValueN
, where Name
is
the argument name and Value
is the corresponding value.
Name-value arguments must appear after other arguments, but the order of the
pairs does not matter.
Before R2021a, use commas to separate each name and value, and enclose
Name
in quotes.
Example: 'Color',[0 0 0]
specifies to plot using only the color
black.
Color
— Red-Green-Blue color triplet
three-element row vector
Red-Green-Blue color triplet, specified as the comma-separated pair
consisting of 'Color'
and a three-element row vector.
By default, confidence intervals that are not limited by parameter
bounds specified in the original fit are plotted using the first default
color (blue), and those that are limited by the bounds are plotted using
the second default color (red). If the confidence interval is not
estimable, it is also plotted in red. To see the default color order,
enter get(groot,'defaultAxesColorOrder')
or see the
ColorOrder property.
Tip
Use this name-value pair when you want to create plots with a single color, for instance, for publication purposes.
Example: 'Color',[0 0 0]
Output Arguments
fh
— Figure handle
handle
Figure handle of the plot, returned as a figure handle.
Version History
Introduced in R2017b
Open Example
You have a modified version of this example. Do you want to open this example with your edits?
MATLAB Command
You clicked a link that corresponds to this MATLAB command:
Run the command by entering it in the MATLAB Command Window. Web browsers do not support MATLAB commands.
Select a Web Site
Choose a web site to get translated content where available and see local events and offers. Based on your location, we recommend that you select: .
You can also select a web site from the following list:
How to Get Best Site Performance
Select the China site (in Chinese or English) for best site performance. Other MathWorks country sites are not optimized for visits from your location.
Americas
- América Latina (Español)
- Canada (English)
- United States (English)
Europe
- Belgium (English)
- Denmark (English)
- Deutschland (Deutsch)
- España (Español)
- Finland (English)
- France (Français)
- Ireland (English)
- Italia (Italiano)
- Luxembourg (English)
- Netherlands (English)
- Norway (English)
- Österreich (Deutsch)
- Portugal (English)
- Sweden (English)
- Switzerland
- United Kingdom (English)