Reconstruct a Signal from Irregularly Sampled Data
People predisposed to blood clotting are treated with warfarin, a blood thinner. The international normalized ratio (INR) measures the effect of the drug. Larger doses increase the INR and smaller doses decrease it. Patients are monitored regularly by a nurse, and when their INRs fall out of the target range, their doses and the frequencies of their tests change.
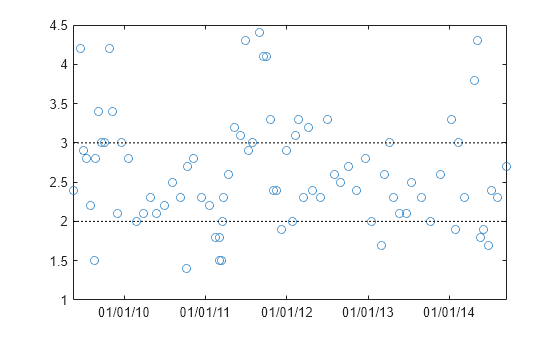
The file INR.mat contains the INR measurements performed on a patient over a five-year period. The file includes a datetime array with the date and time of each measurement, and a vector with the corresponding INR readings. Load the data. Plot the INR as a function of time and overlay the target INR range.
load('INR.mat')

plot(Date,INR,'o','DatetimeTickFormat','MM/dd/yy')

xlim([Date(1) Date(end)])
hold on
plot([xlim;xlim]',[2 3;2 3],'k:')

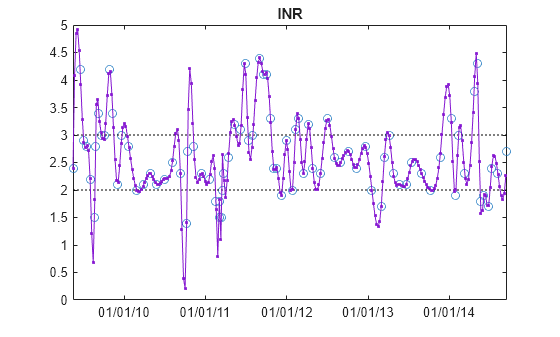
Resample the data to make the INR readings uniformly spaced. The first reading was taken at 11:28 a.m. on a Friday. Use resample to estimate the patient's INR at that time on every subsequent Friday. Specify a sample rate of one reading per week, or equivalently, readings per second. Use spline interpolation for the resampling.
Date.Format = 'eeee, MM/dd/yy, HH:mm';
First = Date(1)
First = datetime
Friday, 05/15/09, 11:28
perweek = 1/7/86400;

[rum,tee] = resample(INR,Date,perweek,1,1,'spline');

plot(tee,rum,'.-','DatetimeTickFormat','MM/dd/yy')

title('INR')
xlim([Date(1) Date(end)])
hold off

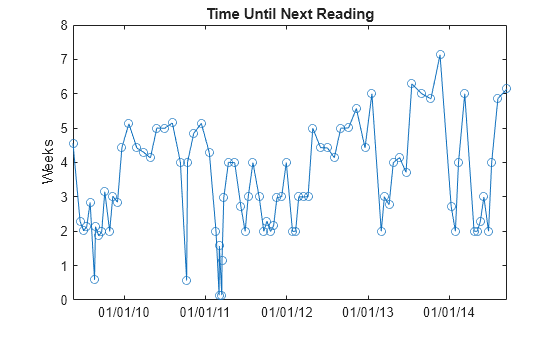
Each INR reading determines when the patient must be tested next. Use diff to construct a vector of time intervals between measurements. Express the intervals in weeks and plot them using the same x-axis as before. For the last point, use the next date prescribed by the anticoagulation nurse. The measurements are carried out in the United States.
nxt = datetime('10/30/2014 07:00 PM','Locale','en_US');

plot(Date,days(diff([Date;nxt]))/7,'o-', ...
    'DatetimeTickFormat','MM/dd/yy')

title('Time Until Next Reading')
xlim([Date(1) Date(end)])
ylabel('Weeks')

When the INR is out of range, the times between INR readings remain short. When the INR is too low, patients get their readings more often because the risk of thrombosis is elevated. When the patient's INR is in range, the times between readings increase steadily until the ratio becomes too small or too large.
The large fluctuations in the resampling could be a sign of overshooting. However, warfarin has an enormous effect on the body. Small changes in warfarin dose can change the INR drastically, as can changes in diet, time spent in airplanes, or other factors. Moreover, when the ratio goes very low (as in late 2010, where the fluctuations are largest), the warfarin is supplemented by emergency injections of enoxaparin, whose effects are even greater.