slewrate
Slew rate of bilevel waveform
Syntax
Description
s = slewrate(x)x. To determine the transitions, the
slewrate function estimates the state levels of the input
waveform by a histogram method and identifies all regions that cross the upper-state
boundary of the low state and the lower-state boundary of the high state.
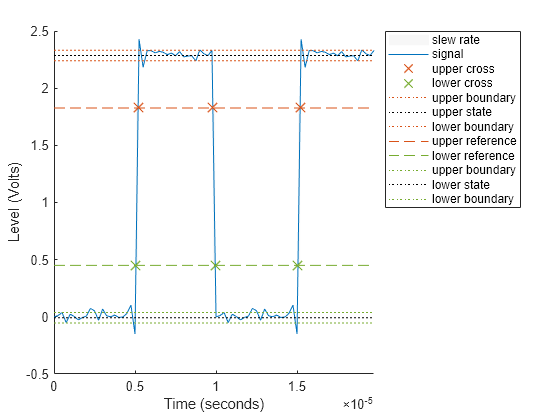
[
returns the time instants when the waveform crosses the lower-percent reference
level s,lt,ut]
= slewrate(___)lt and upper-percent reference level
ut. If you do not specify lower- and upper-percent
reference levels, the levels default to 10% and 90%, respectively. You can specify
an input combination from any of the previous syntaxes.
s = slewrate(___,Name,Value)Name,Value arguments.
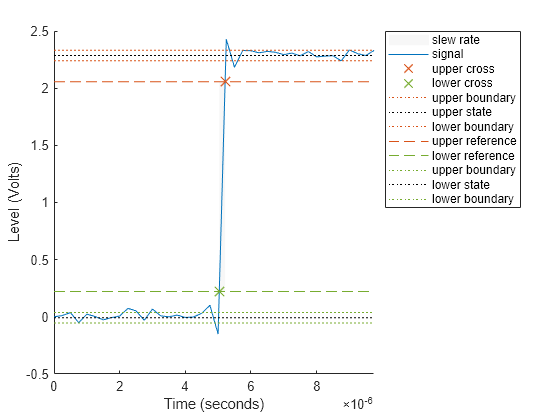
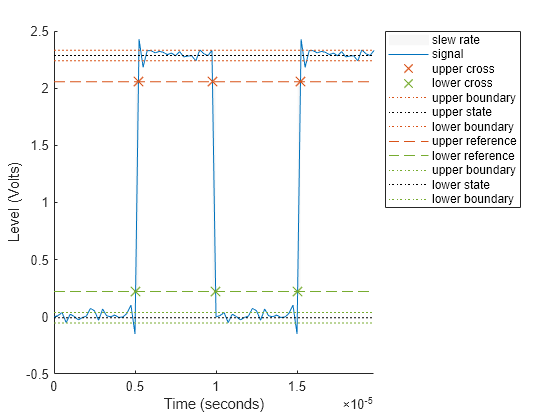
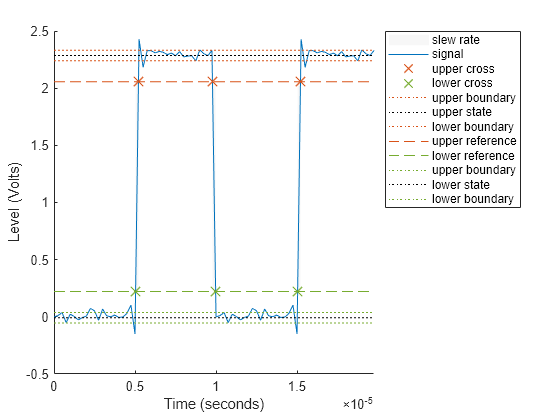
slewrate(___) plots the bilevel waveform and
darkens the regions of each transition where the slew rate is computed. The plot
marks the lower- and upper-reference level crossings and associated reference
levels. The plot also indicates the state levels and associated lower and upper
tolerances.
Examples
Input Arguments
Name-Value Arguments
Output Arguments
More About
References
[1] IEEE® Standard on Transitions, Pulses, and Related Waveforms, IEEE Standard 181, 2003.
Extended Capabilities
Version History
Introduced in R2012a
See Also
falltime | midcross | pulsewidth | risetime | settlingtime | statelevels


