polystab
R2026bStabilize polynomial
Syntax
Description
Examples
Use the window method to design a 25th-order FIR filter with normalized cutoff frequency rad/sample. Verify that it has linear phase but not minimum phase.
h = fir1(25,0.4);

h_linphase = islinphase(h,1)
h_linphase = logical
   1
h_minphase = isminphase(h,1)
h_minphase = logical
   0
Use polystab to convert the linear-phase filter into a minimum-phase filter. Verify that it has linear phase but not minimum phase.
hmin0 = polystab(h);
hmin = hmin0/norm(hmin0)*norm(h);

hmin_linphase = islinphase(hmin)
hmin_linphase = logical
   0
hmin_minphase = isminphase(hmin)
hmin_minphase = logical
   1
Plot the phase responses of the filters.
phasez(h,1)
hold on
phasez(hmin,1)
hold off
legend("h","hmin")
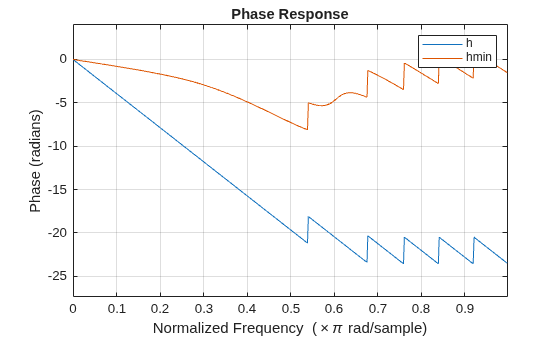
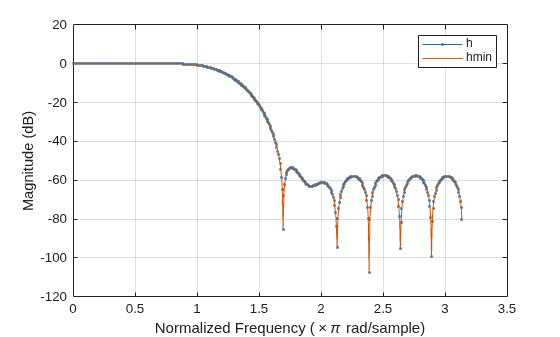
Verify that the two filters have identical magnitude responses.
[hMag,hW] = freqz(h,1);
[hminMag,hminW] = freqz(hmin,1);

plot(hW,mag2db(abs(hMag)),".-")
hold on
plot(hminW,mag2db(abs(hminMag)))
hold off
grid on
xlabel("Normalized Frequency (\times\pi rad/sample)")
ylabel("Magnitude (dB)")
legend(["h" "hmin"])
Since R2026b
Relocate FIR filter zeros inside the unit circle to obtain a minimum phase filter using the polystab function.
Design a bandpass FIR filter with a passband ripple of 0.5 dB and stopband attenuation of 20 dB. The passband frequencies are 0.03π and 0.07π rad/sample. The stopband frequencies are 0.02π and 0.08π rad/sample. Display the filter order, whether it is minimum phase, and the filter zeros and poles in the z-plane.
Hd = designfilt("bandpassfir", ...
    StopbandFrequency1=0.02,PassbandFrequency1=0.03, ...
    PassbandFrequency2=0.07,StopbandFrequency2=0.08, ...
    StopbandAttenuation1=20,PassbandRipple=0.5, ...
    StopbandAttenuation2=20);
table(filtord(Hd),isminphase(Hd), ...
    VariableNames=["Filter Order"; "Is Minimum Phase"])
ans = 1×2 table
    Filter Order    Is Minimum Phase
    ____________    ________________

        229              false
zplane(Hd)
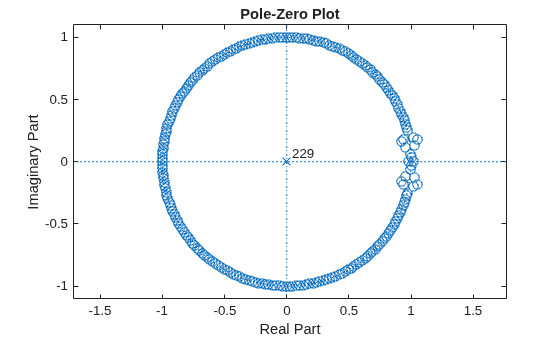
The filter is not minimum phase. A minimum-phase filter has all its zeros inside the unit circle, which is desirable because it has the minimum group delay among all systems with the same magnitude response, its inverse filter is stable and causal, and the energy is concentrated toward the beginning of the impulse response.
You can make the filter minimum phase by using the polystab function to relocate the zeros inside the unit circle. However, the high filter order makes polystab susceptible to numerical inaccuracies. To prevent this issue, split the filter numerator into second-order polynomials.
sos = tf2sos(Hd.Numerator,1);
[splitNum,~] = sos2ctf(sos);
For each split section, use polystab to relocate the zeros initially outside the unit circle to a location inside the unit circle. Scale the relocated locations to preserve the 2-norm at each section.
hStab = zeros(size(splitNum));
for idx = 1:size(splitNum,1)
    h = splitNum(idx,:);
    hStab(idx,:) = polystab(h)*norm(h)/norm(polystab(h));
end
Verify that the updated filter is minimum phase. Display the relocated zeros and poles of the filter in the z-plane. All the zeros are inside the unit circle.
table(filtord(hStab,1,"ctf"),isminphase(hStab,1,"ctf"), ...
    VariableNames=["Filter Order"; "Is Minimum Phase"])
ans = 1×2 table
    Filter Order    Is Minimum Phase
    ____________    ________________

        229              true
zplane(hStab,1,"ctf")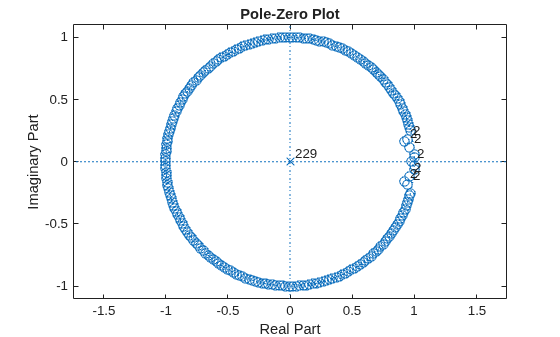
Input Arguments
Output Arguments
Algorithms
The polystab function finds the roots of the polynomial, maps the
roots found outside the unit circle, and relocates them to the inside of the unit
circle:
v = roots(a);
vs = 0.5*(sign(abs(v)-1)+1);
v = (1-vs).*v + vs./conj(v);
b = a(1)*poly(v);
Note
You might encounter numerical instabilities when using polystab
for some high-order FIR filters. This limitation occurs because a high-order polynomial is
more prone to amplify numerical precision differences at the highest-degree terms. To obtain
better results, split a into low-order polynomials. For an example, see
Relocate FIR Filter Zeros Inside Unit Circle.
Extended Capabilities
Version History
Introduced before R2006aSee Also
islinphase | isminphase | roots | zplane

