Design SerDes System and Export IBIS-AMI Model
This example shows how to use the SerDes Designer app to create and analyze a SerDes system and create the IBIS-AMI models for the transmitter and receiver from Simulink®. In this example, you can learn how to design the top-level SerDes system in the app, then export a Simulink model for further time-domain analysis. Finally, you can export the IBIS-AMI models for the finalized SerDes system from Simulink.
Configure SerDes Designer App
Open the SerDes Designer app by typing the following command in the MATLAB® command prompt:
serdesDesigner
Alternately, in the Apps tab, under Signal Processing and Communications, click the app icon.
In the SerDes System window, select AnalogOut block and add an FFE block to its left, as shown by the position of the red cursor. Then select the AnalogIn block and add a CTLE block and a DFECDR block to its right.

Select the FFE block in the Tx subsystem. In the Block Parameters window, change Tap weights from [0 1 0 0 0] to [0 1 0 0], so that the FFE has one pre tap, one main tap, and two post taps. Leave all other blocks in their default settings.
Perform Statistical Analysis
From the Plots section in the app toolstrip, select Add Plots > Pulse Response to display the pulse response of the SerDes system. You can zoom in to your area of interest where pulse equalization works.
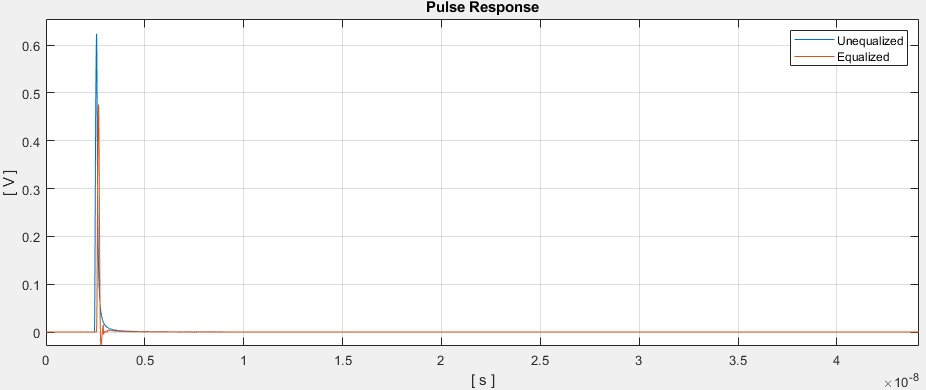
Notice the difference in the pulse response before and after equalization.
Select Add Plots > BER to display the Statistical Eye, Bathtub, and Contours curves overlaid together in a single plot.
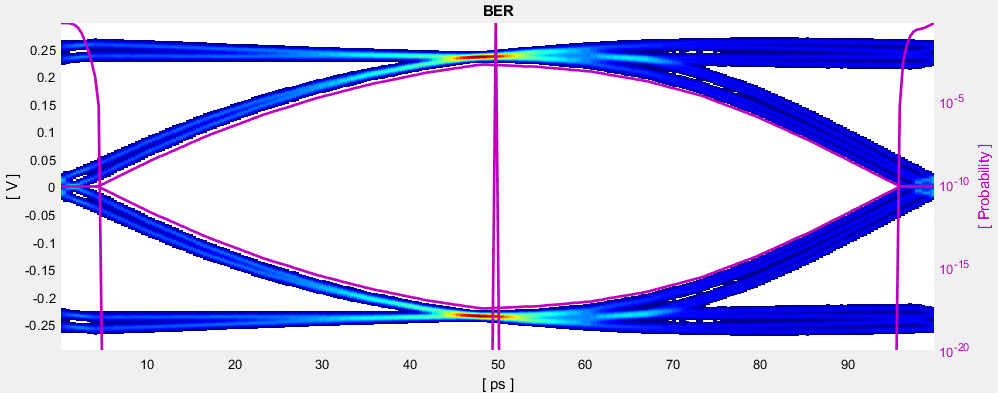
The eye diagram is used to determine the quality of signal integrity. An "open" eye indicates a higher probability of bit recovery. The bathtub curve plots the bit error rate as a horizontal function of the data eye and corresponds to eye width. The contour curve plots the bit error rate as a vertical function of the data eye, and corresponds to eye height.
Select Add Plots > Report to view the SerDes system report.
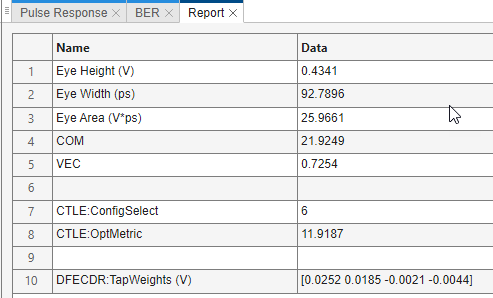
Notice that CTLE:ConfigSelect and DFECDR:TapWeights (V) is determined by the optimization algorithm, since both CTLE and DFECDR blocks were in adapt Mode.
Export SerDes System to Simulink
From the EXPORT tab in the app toolstrip, click the Export ![]() button to export the SerDes system to the Simulink environment. The Simulink canvas contains a model that represents the SerDes system configured in the app.
button to export the SerDes system to the Simulink environment. The Simulink canvas contains a model that represents the SerDes system configured in the app.

Double click the Configuration block to open the Block Parameters dialog box. The parameter values for Symbol time (s), Samples per symbol, Target BER, Modulation, and Signaling is carried over from the SerDes Designer app.
Double click the Stimulus block to open the Block Parameters dialog box. You can define how to create the stimulus pattern and the number of symbols to simulate. This block is not carried over from the SerDes Designer app.
Double click the Tx block to look inside the Tx subsystem. The subsystem has the FFE block carried over from the SerDes Designer app. An Init block is also introduced to model the statistical portion of the AMI model. Double click the FFE block and notice that the parameter values for Tap weights is carried over from the app.
Double click the Analog Channel block to open the Block Parameters dialog box. The parameter values for Target frequency, Loss, Impedance and Tx/Rx analog model parameters is carried over from the SerDes Designer app.
Double click on the Rx block to look inside the Rx subsystem. The subsystem has the CTLE and DFECDR blocks carried over from the SerDes Designer app. An Init block is also introduced to model the statistical portion of the AMI model.
Run Simulation
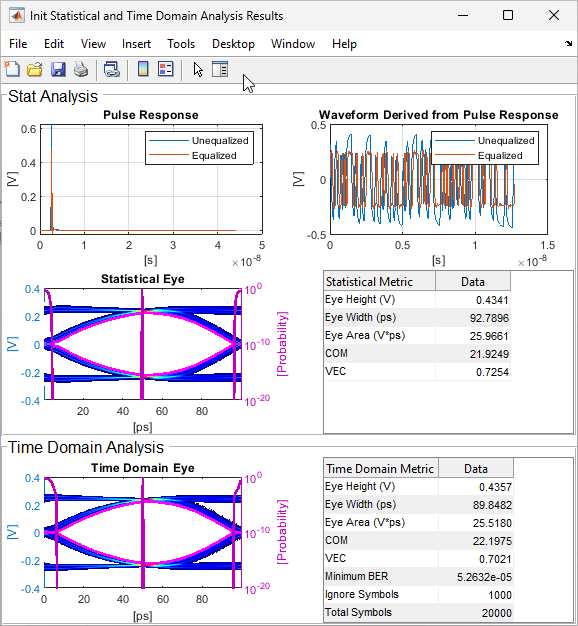
Run the model to simulate the SerDes system. Two plots are generated. The first one is a live time-domain eye diagram that is updated as the model is running.
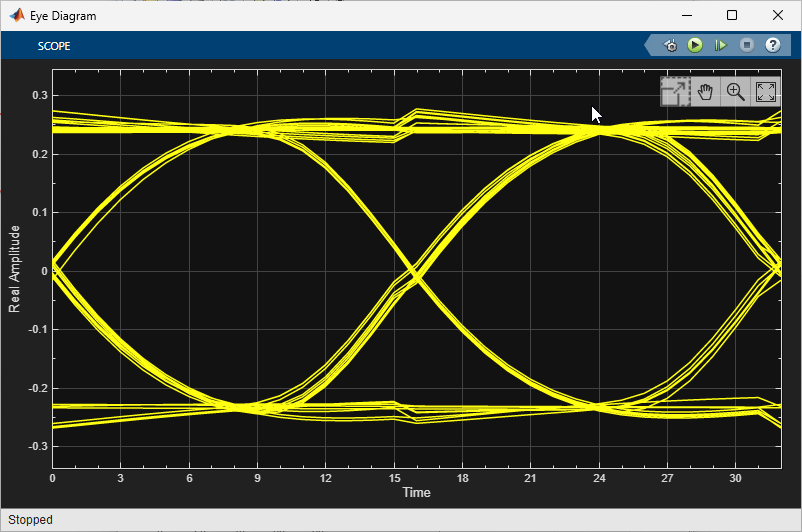
The second plot contains four views of the statistical simulation results and two views of the time-domain simulation results. The statistical simulation results include the pulse response, statistical eye with bathtub and contours curve, output waveform derived from pulse response, and a report including the eye height, eye width, eye area, channel operating margin (COM) and vertical eye closure (VEC). The time-domain results include the time-domain eye and time-domain eye metrics including the eye height, eye width, eye area, COM, VEC, and Minimum BER.
Generate Tx/Rx IBIS-AMI Models
Open the Block Parameter dialog box for the Configuration block and click on the Open SerDes IBIS/AMI Manager button.
In the Export tab, configure the models and files to be exported. Corner percentage scales the I-V and V-T curve data, voltage range, and other IBIS data. AMI Model Settings - Tx and AMI Model Settings - Rx determine whether the exported model processes the Init data, the GetWave data, or both (Dual model).
In the IBIS tab, the analog model values are converted to standard IBIS parameters that can be used by any industry standard simulator.
In the AMI-Tx and AMI-Rx tabs, the reserved parameters are listed first followed by the model-specific parameters, which follow the format of a typical AMI file.
In the Export tab of the SerDes IBIS-AMI Manager parameter window, specify the target directory as C:\Users\<user>\Desktop\DLL and click the Export button. On your desktop, inside a newly created DLL folder, you can find the generated serdes.ibs, serdes_rx.ami and serdes_tx.ami files.
You can now test the IBIS-AMI models in a standard AMI model simulator.
See Also
FFE | CTLE | DFECDR | SerDes Designer