Location-Based Analysis of Visible GPS Satellites
This example shows how to analyze which Global Positioning System (GPS) satellites are visible from a particular location by using satelliteScenario.
Select SEM Almanac
In this example, you add a GPS satellite constellation to the satellite scenario by using a System Effectiveness Model (SEM) almanac file. You can select whether to use a stored SEM almanac file or the latest SEM almanac file by changing the value of useSEMAlmanac.
To use the data from a stored SEM almanac file, set
useSEMAlmanactostored. By default, the example looks for a stored SEM almanac file with the filenamegpsAlmanac.txt. To specify a different SEM almanac file, specifysemAlmanacFileNameas the relative or absolute path to your stored SEM almanac file.To obtain the latest SEM almanac file from the Navigation Center website at www.navcen.uscg.gov, set
useSEMAlmanactolatest. To use the latest SEM almanac file, you must have write permissions for the working folder. Normally, the Navigation Center website uploads the almanac file once a day, as mentioned in Section 3.2.2.4 of GPS Interface Control Document ICD-GPS-240, Revision D [1].
useSEMAlmanac ="stored"; if useSEMAlmanac == "stored" % Provide the SEM almanac file name semAlmanacFileName = "gpsAlmanac.txt"; else % Download the latest SEM almanac file from the Navigation Center % website and store the file url = "https://www.navcen.uscg.gov/sites/default/files/gps/almanac/current_sem.al3"; currentDay = string(datetime("today",TimeZone="UTC")); semAlmanacFileName = "gps_SEM_" + currentDay + "_UTC.txt"; websave(semAlmanacFileName,url); end
Create Satellite Scenario
Create a satellite scenario with a start time and stop time such that your query is always within the simulation time. Set the simulation sample time to 60 seconds. If you use a stored almanac file, the default query time of this example is 24-June-2021 0:00:48 AM UTC. If you use the latest SEM almanac file, the example instead defaults to querying at the current date and time.
if useSEMAlmanac == "stored"
    % Provide the queryTime
    queryTime = datetime(2021,6,24,0,0,48,TimeZone="UTC");
else
    % Uses the latest SEM Almanac file. Set the queryTime to current date
    % and time.
    queryTime = datetime("now",TimeZone="UTC");
end
startTime = queryTime - hours(12);
stopTime = queryTime + hours(13);
sampleTime = 60;
sc = satelliteScenario(startTime,stopTime,sampleTime);
Add GPS Satellite Constellation
Add GPS satellites to the scenario using the SEM almanac file.
sat = satellite(sc,semAlmanacFileName);
Add Ground Station
Add a ground station of interest by specifying its latitude and longitude. Specify the minimum elevation angle from which the ground station can determine the link closure. By default, this example adds the MathWorks® campus in Hyderabad as the ground station.
latitude = 17.43465658;                   % In degrees
longitude = 78.38228397;                  % In degrees
minElevAngle = 10;                        % In degrees
gs = groundStation(sc,latitude,longitude, ...
    MinElevationAngle=minElevAngle);
Add Access Analysis
To determine if a line of sight (LOS) exists between the ground station and the GPS satellites, add access analysis between the GPS satellites and the ground station.
ac = access(sat,gs);
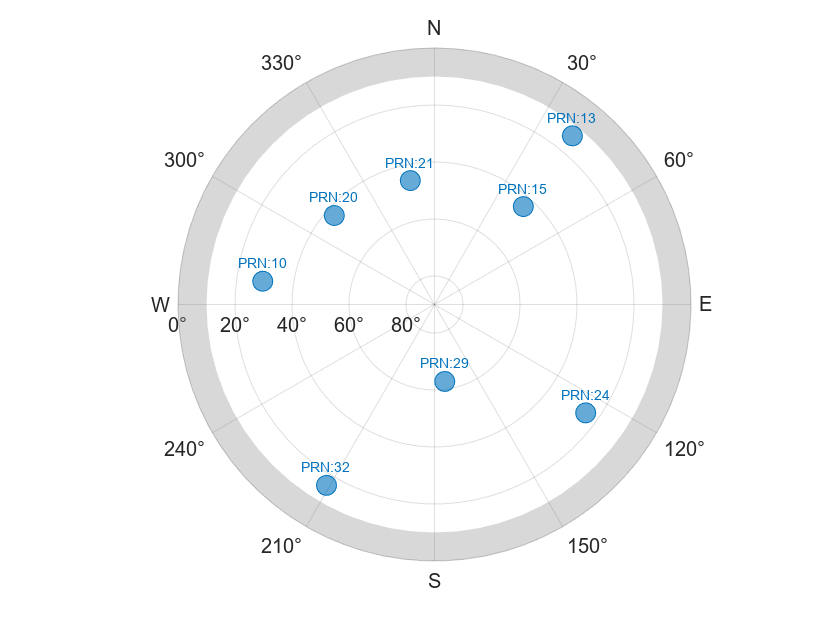
Visualize Visible GPS Satellites
To visualize the visible GPS satellites, follow these steps.
Find the satellites visible to the ground station using the
accessStatusfunction.Find the azimuth and elevation angles of the visible satellites from the ground station using the
aerfunction.View the visible satellites in a sky plot using the
skyplotfunction.
acStats = accessStatus(ac,queryTime);
[az,el] = aer(gs,sat(acStats),queryTime);
skyplot(az,el,sat(acStats).Name,MaskElevation=gs.MinElevationAngle)
Visualize the visible satellites using the satellite scenario.
% View the satellite scenario at queryTime. queryTime must be within the
% start and stop times of the scenario.
v = satelliteScenarioViewer(sc,CurrentTime=queryTime,ShowDetails=false);
% Set the camera position such that all links from satellites to ground
% station are in clear view
campos(v,gs.Latitude,gs.Longitude,gs.Altitude+6e7);
This snapshot shows the satellite scenario viewer with the default example settings.

Obtain the locations of all the visible satellites from the start time to the stop time of the scenario, and animate the visible satellites using the skyplot function.
% Get the status of access across the time history of the scenario
[acStatsAllTime,timeHistory] = accessStatus(ac);
[azHistory,elHistory] = aer(gs,sat);

% Number of timestamps run by the scenario
numTimeStamps = numel(timeHistory);

% When you have no access, set the elevation angle history to NaN
elHistory(acStatsAllTime == 0) = NaN;

% Transpose the histories of the azimuth angles and elevation angles to
% have timestamps as rows, which helps plot skyplot
azHistoryTranspose = azHistory';
elHistoryTranspose = elHistory';

% Visualize the visible satellites over time
sp = skyplot([],[],MaskElevation=gs.MinElevationAngle);
for tIdx = 1:numTimeStamps
    set(sp, ...
        AzimuthData=azHistoryTranspose(tIdx,:), ...
        ElevationData=elHistoryTranspose(tIdx,:), ...
        LabelData=sat.Name);
    % For slower animation, use 'drawnow' instead of 'drawnow limitrate'
    drawnow limitrate
end

Generate Satellite Visibility Chart
Plot the visible satellites as a function of time.
% Find the PRN index of each satellite
satNames = char(sat(:).Name');
prnIndex = double(string(satNames(:,5:end)));

% To better visualize each GPS satellite, scale the status with the PRN
% index
acStatsAllTime = double(acStatsAllTime);
acStatsAllTime(acStatsAllTime == 0) = NaN;

% Plot the satellite visibility chart
colors = colororder;
firstLineColor = colors(1,:);
plot(timeHistory,prnIndex.*acStatsAllTime, ...
    Color=firstLineColor,LineWidth=1)
xlim([timeHistory(1) timeHistory(end)])
ylim([min(prnIndex)-1 max(prnIndex)+1])
xlabel("Time")
ylabel("Satellite PRN Index")
title("Satellite Visibility Chart")
yticks(prnIndex)
grid on

Further Exploration
This example shows all the GPS satellites visible to a ground station. Try running the example with these modifications.
Vary the ground station location, and observe the visible satellites at a particular time instance.
Use the latest SEM almanac file, and observe the visible and operational satellites.
References
[1] ICD-GPS-240, Rev: D. NAVSTAR GPS Control Segment to User Support Community Interfaces. May 21, 2021; Code Ident: 66RP1.
See Also
Objects
Functions
access|accessStatus|aer|skyplot|groundStation