Main Content

mlreportgen.ppt.FlowDirection Class

Namespace: mlreportgen.ppt

Table column flow direction

Since R2020a

Description

Use an mlreportgen.ppt.FlowDirection format object to specify the order of table columns in a PPT API presentation.

The mlreportgen.ppt.FlowDirection class is a handle class.

Class Attributes

ConstructOnLoad
true
HandleCompatible
true

For information on class attributes, see Class Attributes.

Creation

Description

flowDirectionObj = mlreportgen.ppt.FlowDirection sets the Value property to 'LeftToRight'.

example

flowDirectionObj = mlreportgen.ppt.FlowDirection(flow) sets the Value property to flow.

Properties

expand all

Table column flow direction, specified as a character vector or string scalar. Specify one of these values:

  • 'LeftToRight' — Orders columns from left to right

  • 'RightToLeft' — Orders columns from right to left

ID for this PPT API object, specified as a character vector or string scalar. A session-unique ID is generated as part of the object creation. You can specify an ID to replace the generated ID.

Attributes:

NonCopyable
true

Data Types: char | string

Tag for this PPT API object, specified as a character vector or string scalar. A session-unique tag is generated as part of the creation of this object. The generated tag has the form CLASS:ID, where CLASS is the object class and ID is the value of the Id property of the object.

Specifying your own tag value can help you to identify where issues occur during presentation generation.

Attributes:

NonCopyable
true

Data Types: char | string

Examples

collapse all

To specify the order of table columns, add an mlreportgen.ppt.FlowDirection format object to the Style property of an mlreportgen.ppt.Table object. This example specifies a right-to-left column order.

Create a presentation.

import mlreportgen.ppt.*
ppt = Presentation("myFlowDirection.pptx");
open(ppt);

Add a slide to the presentation.

slide = add(ppt,"Title and Content");

Create a table and specify the column flow direction.

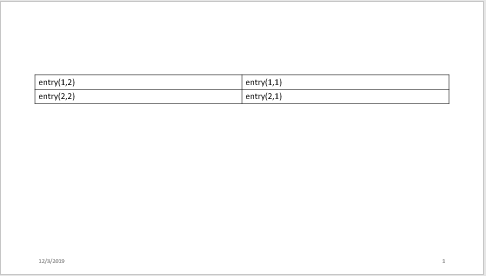
t = Table({'entry(1,1)', 'entry(1,2)'; 'entry(2,1)', 'entry(2,2)'});
t.Style = [t.Style {FlowDirection("RightToLeft")}];

Add the table to the slide.

replace(slide,"Content",t);

Close and view the presentation.

close(ppt);
rptview(ppt);

In the generated table, the second column appears first.

Version History

Introduced in R2020a