Visualization and Data Export
You can use RF Toolbox™ functions to visualize component or network behavior:
Smith® Chart
Rectangular plots
Polar plots
The RF domain uses many types of data files, including industry-standard
Touchstone files (.s2p) and AMP files, a MathWorks® nonlinear file format. You can write data into these files
using several different RF Toolbox functions.
You can also export a network to Verilog-A format for use as a test environment in an analog circuit simulator. See Export Verilog-A Model.
RF Toolbox supports reading and writing Touchstone 1.1 files and reading Touchstone 2.0 files (since R2023b).
Functions
Topics
- Model RF Objects Using Verilog-A
Learn to model RF objects using Verilog-A.
- Analyze and Plot RF Components
Learn to use RF Toolbox functions to analyze RF components in frequency-domain and to compute and plot time-domain response.
- Export Component Data to File
Learn to export RF object data to industry-standard data files and MathWorks AMP files.
- Export Verilog-A Model
Learn to export Verilog-A description of an RF component using a rational function model.
Featured Examples
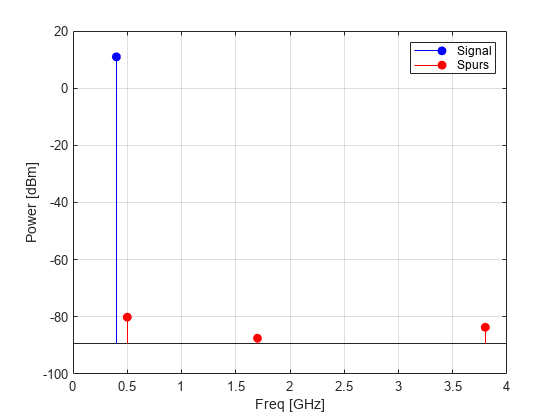
Visualize Mixer Spurs
Plot the mixer spurs.
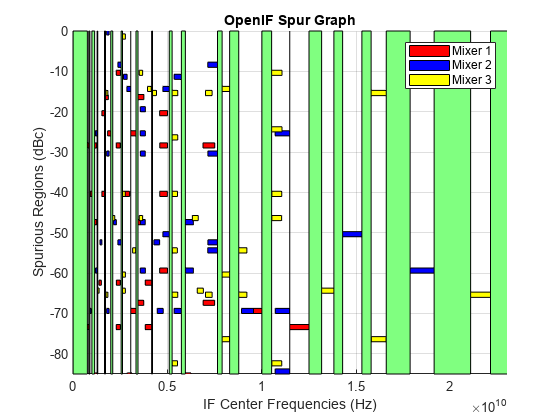
Finding Free IF Bandwidths
Select IF that is free from any intermodulation distortion.
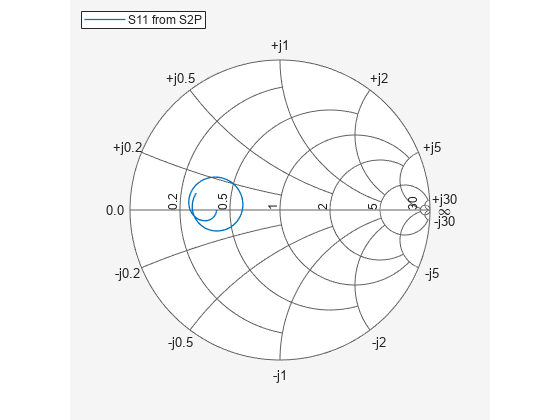
Write S2P Touchstone Files
Write the data created in the MATLAB workspace into a Touchstone file.