Radar Coordinate Systems and Frames
This page provides definitions for radar coordinate systems and frames through a
radarScenario workflow example that uses
platform and radarDataGenerator objects.
Topics covered include:
Overview
This table provides information on the coordinate frames used in Radar Toolbox™.
| Coordinate Frame | Definition | How to Model Using Radar Toolbox™ | Coordinate System(s) |
|---|---|---|---|
Global Frame
| A global frame is the highest level frame. All other frames are referenced within it. |
| Define scenario origin using either:
|
Body Frame
| A body frame is typically centered in a
platform and oriented in the same direction as the platform.
Typically, the x-axis represents the forward
orientation of the body. The origin of the body frame is therefore
the position of the object or platform in the global frame. Sensors,
such as |
Radar cross-section signature, specified
as | Define platform origin using either:
|
Mounting Frame
| A mounting frame is the frame in which
the sensor is referenced and mounted. The origin and orientation of
the mounting frame is a position relative to the
|
| Define mount origin through parameters
|
Sensor Frame
| A sensor frame represents the position and orientation of the sensor. For a rotating sensor:
| Specify scanning limits
for
Specify the range of coverage in degrees
for
| Same as Mounting Frame. |


Global Coordinate Reference Frame
A coordinate system measures position within coordinate reference frames that have an origin and an orientation. Reference frames are represented by orthogonal unit vectors which originate from the same point and denote orientation.
Local coordinate reference frames originate from a known point in a global coordinate frame or from an arbitrary point. In Radar Toolbox™, they are often centered in the bodies of
platformobjects or sensor objects.Global coordinate reference frames in Radar Toolbox™ can have a geocentric origin, such as the center of the earth, or an arbitrary origin, depending on the value of the
radarScenarioobject parameterIsEarthCentered. Local coordinate origins are determined in reference to the global coordinate reference frame.
The IsEarthCentered parameter of
radarScenario determines the global frame for the entire
scenario.
If
IsEarthCenteredistrue, theradarScenarioframe is a geocentric coordinate reference frame. SetIsEarthCenteredtotruewhen Earth curvature matters, such as over longer distances. WhenIsEarthCenteredistrue, platform trajectories must be defined as geocentric states using thegeoTrajectoryobject.If
IsEarthCenteredisfalse, then theradarScenarioframe originates from an arbitrary point and is measured using Geographic Coordinates. SetIsEarthCenteredtofalseif Earth curvature does not matter. WhenIsEarthCenteredisfalse, platform trajectories must be defined in Cartesian states usingkinematicTrajectoryorwaypointTrajectory.
Radar Toolbox™ uses two geocentric coordinate reference frames: the perfect sphere and the WGS84 oblate spheroid model of the earth. These reference frames have either a Cartesian system or a geographic coordinate system applied to them.
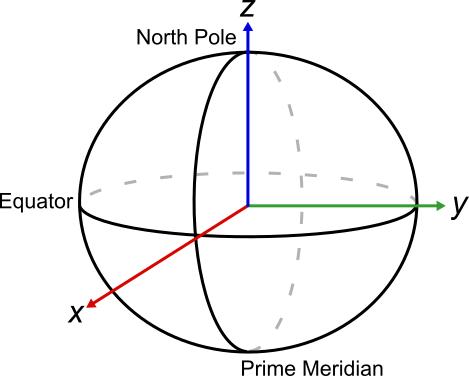
Earth-Centered Earth-Fixed Coordinate System
An Earth-centered Earth-fixed (ECEF) system (also known as a geocentric coordinate system) uses Cartesian Coordinate Systems xyz to represent position relative to the center of the reference ellipsoid.
The positive x-axis intersects the surface of the ellipsoid at 0° latitude and 0° longitude, where the equator meets the prime meridian.
The positive y-axis intersects the surface of the ellipsoid at 0° latitude and 90° longitude.
The positive z-axis intersects the surface of the ellipsoid at 90° latitude and 0° longitude or the North Pole.
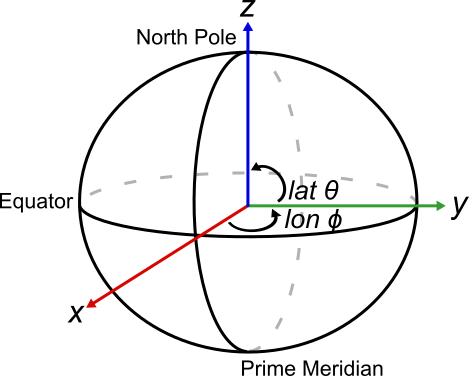
Geographic Coordinate System
A geographic coordinate system uses the coordinates (latitude, longitude, height) to represent position relative to a reference ellipsoid.
Latitude is measured as the angle between the equatorial plane and the line made by tracing from the center of the Earth to the point on Earth being measured. It ranges from [–90° 90°] with positive values corresponding to the north and negative values corresponding to the south.
Longitude is measured as the angle between the prime meridian plane and the line made by tracing from the center of the earth to the point on Earth being measured. It ranges from [–180° 180°] or [0° 360°] counterclockwise from the meridian looking down from the North Pole.
Height is measured as the length of a line perpendicular to a plane tangent to the point on the Earth directly below the point being measured. In other words, height is referenced to the ellipsoid or terrain model, depending on which is being used.
Local Coordinate Systems
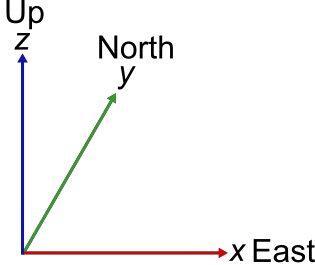
Both Cartesian coordinates and spherical coordinates are coordinate systems that can be applied to different coordinate reference frames. Cartesian coordinates can be categorized further into either north-east-down (NED) or east-north-up (ENU) coordinate systems.
Cartesian Coordinate Systems
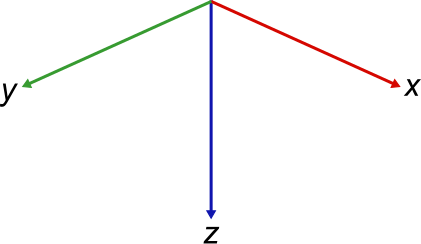
A Cartesian coordinate system is a two or three-dimensional coordinate system often measured in xyz.

Radar uses the right-handed world coordinate system. To understand this, hold your right hand flat with your palm facing up. In this position, the direction of your thumb is the direction of the z-axis. The direction of your fingers is the x-axis. Curl your fingers inwards towards your palm, forming a right angle with the line your fingers made while straight. This is the y-axis. As you straighten your hand again, your fingers point back in the direction of the x-axis. Radar coordinate systems using xyz always follow this system.

Cartesian coordinates are applied as north-east-down or east-north-up coordinates, which are typically measured in meters.
A north-east-down (NED) system is a local reference system that uses Cartesian coordinates (xNorth, yEast, zDown) to represent position relative to a local origin. This follows the right-handed world coordinate system. The local origin is described by the geographic coordinates (latitude, longitude, height). Typically, the local NED system is above the surface of the Earth, such as centered in the body of a flying plane. While the local origin point can change in relation to geographic coordinates, the axes always point directly north, east, and down. Therefore, the z-axis orients downwards from the center of the flying plane.

An east-north-up (ENU) system is a local reference system that uses Cartesian coordinates (xEast, yNorth, zUp) to represent position relative to a local origin. This follows the right-handed world coordinate system. The local origin is described by the geographic coordinates (latitude, longitude, height). While the local origin point can change in relation to geographic coordinates (for example, if the local origin is centered in a moving plane), the axes always point directly north, east, and up.
For example, imagine a platform is 3 meters in the x-direction, 5 meters in the y-direction, and 1 meter in the z-direction.
If using a NED frame, which is typical in Radar applications, this platform is 3 meters north, 5 meters east, and 1 meter down. If the
radarScenarioorigin is defined as some longitude, some latitude, and a height of 100 meters withIsEarthCenteredset totrue, the platform would be 3 meters north from this point, 5 meters east, and 1 meter down. In the frame of the actual scenario, the platform is 99 meters in height.If using an ENU frame, this platform is 3 meters east, 5 meters north, and 1 meter up. If the
radarScenarioorigin is defined as some longitude, some latitude, and a height of 100 meters withIsEarthCenteredset totrue, the platform would be 3 meters east from this point, 5 meters north, and 1 meter up. In the frame of the actual scenario, the platform is 101 meters in height.
Any of the three coordinate systems above can be applied to a reference frame. For example, imagine a global frame, such as the geocentric frame that is being measured using geographic coordinates. Imagine a local frame originating from the orange point at (42°, –71°, 0) (latitude, longitude, altitude) which is measured in a NED Cartesian system. The NED system originates from that point to measure in meter units in directions North, East, and Down. Within this system, there exists a global frame, a point on that global frame representing the origin of the local frame, and a local frame. The global frame is measured geographically and the local frame is measured in Cartesian coordinates.

Spherical Coordinate Systems
A spherical coordinate system operates using (ɸ, θ, range) to represent position relative to a local origin. In radar, this system is usually referred to using (azimuth, elevation, range) or (AER). Like the Cartesian coordinate systems above, spherical coordinates are applied to a reference frame. The geographic coordinate system (latitude, longitude, altitude) is a form of the spherical coordinate system. The spherical coordinate system is applied to sensors that rotate around an origin, or it is used to measure latitude and longitude on an earth-centered global reference frame.
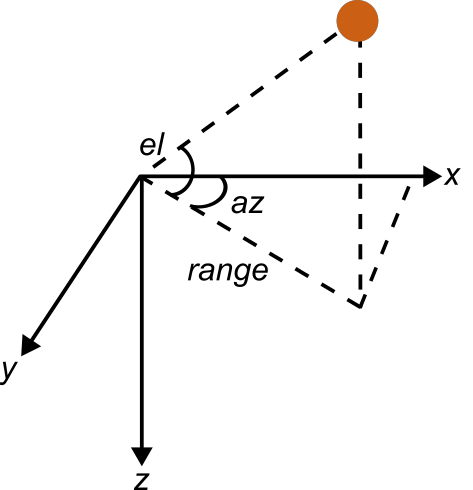
Azimuth ranges from [–180° 180°] with positive direction being clockwise from the x-axis and negative direction being counterclockwise from the x-axis. The x-axis represents 0°.

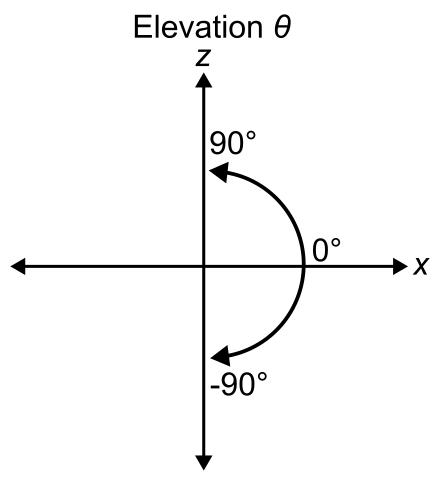
Elevation ranges from [–90° 90°] with positive direction being counterclockwise from the x-axis and negative direction being clockwise from the x-axis. The x-axis represents 0°.
Simple radarScenario Workflow
This example shows how to configure a simple radarScenario with a platform and radarDataGenerator.
Construct radarScenario
First, define a radarScenario. This object represents the Global Coordinate Reference Frame for the entire radarScenario. All other frames are in reference to the radarScenario frame in a descending hierarchy. In other words, they must all be local frames and measured in Local Coordinate Systems.
scenario = radarScenario();
Second, define a Platform object using the platform function. Platform objects can be used to model radar platforms or targets.
If
radarScenarioparameterIsEarthCenteredis set tofalse(default), then thePositionparameter of theplatformis measured in Cartesian Coordinate Systems in reference to the scenario coordinate frame.If
radarScenarioparameterIsEarthCenteredis set totrue, then thePositionparameter of theplatformis measured in relation to a Global Coordinate Reference Frame.
Plot radarScenario using theaterPlot
Construct the theaterPlot to plot radarScenario objects.
tp = theaterPlot(XLimits=[-10 10],YLimits=[-10 10],ZLimits=[-10 10]);
title("radarScenario Origin")
view(70, 50)
grid on
Label the origin of the scenario.
labelPlotter = platformPlotter(tp, ...
    DisplayName="Scenario Origin", Marker="o");
plotPlatform(labelPlotter, [0 0 0]);

Construct platform
Define the Position of the platform at construction as being 3 meters in the x-direction, 3 meters in the y-direction, and one meter in the z-direction from the scenario frame. See Cartesian Coordinate Systems to understand how this translates to NED and ENU Cartesian frames. platform Position can only be set on construction. Otherwise, platform Trajectory must be used. If Position is set on construction, the platform remains stationary.
radarPlatform = platform(scenario, Position=[3 3 1], Orientation=[45 0 0]); % Position=[X Y Z]
radarPlatform.Dimensions = struct(Length=8, ...
    Width=2.45, ...
    Height=2.95, ...
    OriginOffset=[0 0 0]);
The read-only Position of the platform is also the origin of the platform. When the Dimensions parameter is set, the origin is, by default, be the center of the shape constructed by using Dimensions unless the OriginOffset is specified.
radarPlatform.Trajectory.Position
ans = 1×3

     3     3     1
The platform has an Orientation parallel to the global Orientation of the scenario frame unless platform is rotated. The x-y-z vectors representing the platform Orientation originate from the origin point of the platform. The read-only property Orientation returns a quaternion value. Convert the quaternion value to Euler degrees for readability.
eulerd(radarPlatform.Trajectory.Orientation,"ZYX","frame") % default orientation
ans = 1×3

   45.0000         0         0
Plot platform using platformPlotter
Plot the platform Dimensions, Position, and Orientation.
pPlotter = platformPlotter(tp, DisplayName="Radar Platform");
orientation = quaternion(radarPlatform.Orientation, ...
    "eulerd", "zyx", "frame");
plotPlatform(pPlotter, radarPlatform.Position, ...
    radarPlatform.Dimensions, ...
    orientation);

platformOrientation = orientationPlotter(tp, ...
    DisplayName="Platform", LocalAxesLength=10);
plotOrientation(platformOrientation, ...
    radarPlatform.Orientation(3), ... % roll or X
    radarPlatform.Orientation(2), ... % pitch or Y
    radarPlatform.Orientation(1), ... % yaw or Z
    radarPlatform.Position);
title("platform in radarScenario with Orientation")

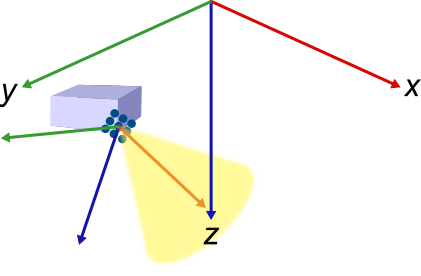
Construct radarDataGenerator
Add a sensor to the platform. The sensor frame is local to the platform frame. The sensor frame translates and rotates as the platform frame translates or rotates. The sensor frame can also rotate around its mounting frame, which is the origin of the sensor.
radar = radarDataGenerator(1);
radarPlatform.Sensors = radar;
The sensor MountingLocation is measured in Cartesian Coordinate Systems in relation to the platform coordinate frame. To mount the sensor on the front and top of the platform, divide each Dimension of the platform by 2, remembering the origin of the platform is actually the center of the shape. Set the z-direction as negative because radarScenario is, by default, measured in NED, making the positive z-direction point down instead of up.
radar.MountingLocation = [radarPlatform.Dimensions.Length/2 ...
    radarPlatform.Dimensions.Width/2 ...
    -radarPlatform.Dimensions.Height/2]; % default [X Y Z]
The sensor MountingAngle alters the orientation of the sensor from its default orientation, which is parallel to the orientation of the platform. Rotate the sensor 20 degrees around the z-axis, so it points slightly right compared to the orientation of the platform.
radar.MountingAngles = [20 0 0]; % default [Z Y X]You can add more sensors and platforms to a single radarScenario.
Plot radarDataGenerator using orientationPlotter
Plot the sensor Position and Orientation. Add the sensor MountingAngles to the platform Orientation to plot the scenario orientation of the sensor.
sensorOrientation = orientationPlotter(tp, DisplayName="Sensor", ...
    LocalAxesLength=10, MarkerFaceColor="yellow");
plotOrientation(sensorOrientation, ...
    radar.MountingAngles(3) + radarPlatform.Orientation(3), ... % yaw or X
    radar.MountingAngles(2) + radarPlatform.Orientation(2), ... % pitch or Y
    radar.MountingAngles(1) + radarPlatform.Orientation(1), ... % roll or Z
    radarPlatform.Position + radar.MountingLocation);
title("sensor on platform in radarScenario with Orientation")

Additional Radar Coordinate Conventions
Additional Terms
| Term | Definition | How to Model Using Radar Toolbox™ | Coordinate System(s) |
|---|---|---|---|
Clutter Region
| The clutter region is the surface
where the sensor beam intersects with the ground when a
|
Learn more about Clutter Simulation at Introduction to Radar Scenario Clutter Simulation. | Define
Automatic mainlobe clutter is based on the beam angle of the corresponding sensor using:
|
Radar Cross-Section Signature
| Radar cross-section signature represents target energy reflection. The greater a target reflection, the more easily the echo is received by a radar receiver. Radar cross-section signature is typically measured in square meters, representing the apparent area, though the actual area could be greater or lesser. Radar cross-section signature is measured from the center of the target and relative to the platform orientation. |
Learn more about Radar Cross Section at Modeling Target Radar Cross Section. There are several functions that return the RCS pattern of typical shapes:
|
|

Coordinates of Radar Cross-Section Signature
Radar cross-section signature is measured in spherical coordinates (azimuth and elevation) in the target's local coordinate system, which originates from the center of the target.
Since a perfect sphere is symmetrical across all axes, RCS can be considered the same across all directions. For asymmetrical targets, reflections cannot be considered the same across all directions. In that case, RCS varies with the incident angles (also known as aspect angles). Aspect-dependent RCS patterns can be measured or modeled just as you would antenna radiation patterns. The result of such measurements or models is a table of RCS values as a function of azimuth and elevation angles in the target's local coordinate system.
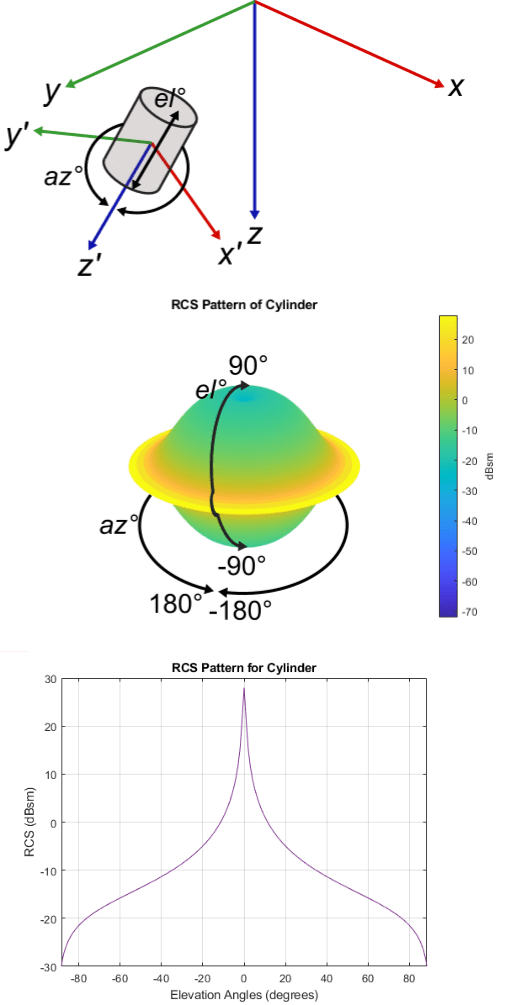
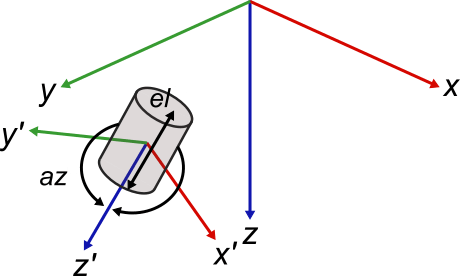
Below is a global frame containing a cylindrical platform that has its own body frame originating from its center.
This is the RCS pattern of the cylinder. As can be seen, the pattern is identical azimuthally. Any strip which covers the entire elevation represents the RCS pattern of the entire elevation. For example, the black line on the image can be rotated 360° azimuthally to represent the entire RCS pattern. To capture the entire RCS for the cylinder, the most important parameter is elevation from [–90° 90°].

The graph is another way of looking at the RCS pattern of the cylinder. As azimuth does not matter in the cylindrical RCS above, RCS (dBsm) can be directly plotted against elevation to represent the RCS of the entire cylinder.

As can be seen in the above images, RCS is plotted as a function of elevation measured from the center of the target body.
See Also
radarScenario | platform | radarDataGenerator | radarTransceiver | eulerd (Sensor Fusion and Tracking Toolbox)