plot
Display locations of scatterers on bicyclist
Description
Examples
Compute the backscattered radar signal from a bicyclist moving along the x-axis at 5 m/s away from a radar. Assume that the radar is located at the origin. The radar transmits an LFM signal at 24 GHz with a 300 MHz bandwidth. A signal is reflected at the moment the bicyclist starts to move and then one second later.
Initialize Bicyclist, Waveform, and Propagation Channel Objects
Initialize the backscatterBicyclist, phased.LinearFMWaveform, and phased.FreeSpace objects. Assume a 300 MHz sampling frequency. The initial position of the bicyclist lies on the x-axis 30 meters from the radar.
bw = 300e6;
fs = bw;
fc = 24e9;
radarpos = [0;0;0];
bpos = [30;0;0];
bicyclist = backscatterBicyclist( ...
    'OperatingFrequency',fc,'NumWheelSpokes',15, ...
    'InitialPosition',bpos,'Speed',5.0, ...
    'InitialHeading',0.0);
lfmwav = phased.LinearFMWaveform( ...
    'SampleRate',fs, ...
    'SweepBandwidth',bw);
sig = lfmwav();
chan = phased.FreeSpace( ...
    'OperatingFrequency',fc, ...
    'SampleRate',fs, ...
    'TwoWayPropagation',true);
Plot Initial Bicyclist Position
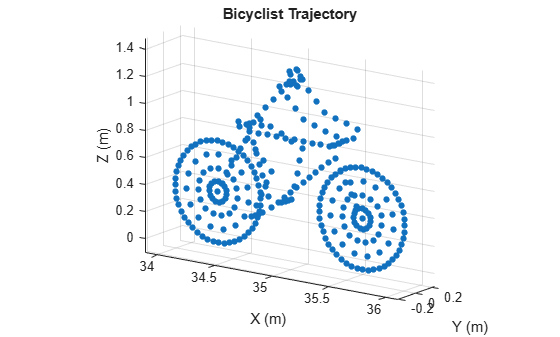
Using the move object function, obtain the initial scatterer positions, velocities and the orientation of the bicyclist. Plot the initial position of the bicyclist. The dt argument of the move object function determines that the next call to move returns the bicyclist state of motion dt seconds later.
dt = 1.0;
[bpos,bvel,bax] = move(bicyclist,dt,0);
plot(bicyclist)

Obtain First Reflected Signal
Propagate the signal to all scatterers and obtain the cumulative reflected return signal.
N = getNumScatterers(bicyclist);
sigtrns = chan(repmat(sig,1,N),radarpos,bpos,[0;0;0],bvel);
[rngs,ang] = rangeangle(radarpos,bpos,bax);
y0 = reflect(bicyclist,sigtrns,ang);
Plot Bicyclist Position After Position Update
After the bicyclist has moved, obtain the scatterer positions and velocities and then move the bicycle along its trajectory for another second.
[bpos,bvel,bax] = move(bicyclist,dt,0);
plot(bicyclist)
Obtain Second Reflected Signal
Propagate the signal to all scatterers at their new positions and obtain the cumulative reflected return signal.
sigtrns = chan(repmat(sig,1,N),radarpos,bpos,[0;0;0],bvel);
[~,ang] = rangeangle(radarpos,bpos,bax);
y1 = reflect(bicyclist,sigtrns,ang);
Match Filter Reflected Signals
Match filter the reflected signals and plot them together.
mfsig = getMatchedFilter(lfmwav);
nsamp = length(mfsig);
mf = phased.MatchedFilter('Coefficients',mfsig);
ymf = mf([y0 y1]);
fdelay = (nsamp-1)/fs;
t = (0:size(ymf,1)-1)/fs - fdelay;
c = physconst('LightSpeed');
plot(c*t/2,mag2db(abs(ymf)))
ylim([-200 -50])
xlabel('Range (m)')
ylabel('Magnitude (dB)')
ax = axis;
axis([0,100,ax(3),ax(4)])
grid
legend('First pulse','Second pulse')

Compute the difference in range between the maxima of the two pulses.
[maxy,idx] = max(abs(ymf));
dpeaks = t(1,idx(2)) - t(1,idx(1));
drng = c*dpeaks/2
drng =
4.9965
The range difference is 5 m, as expected given the bicyclist speed.
Input Arguments
Output Arguments
Version History
Introduced in R2019b