Run Polyspace as You Code in Eclipse and Review Results
You can configure Polyspace® as You Code™ to run on each save in your Eclipse™-based IDE, or you can start the analysis manually. The analysis runs on the file that is currently active in the IDE. After analysis, you see bugs and coding standard violations as source code markers or in a separate list.
Check Installation and Start Plugin
To confirm that the Polyspace as You Code plugin is installed in your Eclipse-based IDE, check the list of installed plugins.
Select Help > About Eclipse IDE.
Click Installation Details and type
polyspacein the search bar on the Plug-ins tab.
To start the Polyspace as You Code plugin, open a C or C++ file in the editor. The plugin does not start automatically when you open the Eclipse IDE if no C or C+ file is open in the editor. You can confirm that the extension starts as expected in the Console view. To open this view, select Window > Show View > Console. If the plugin starts without errors, you see a message similar to this:
[2023-01-26 00:43:42.68] [Information] No setting set for the port. Trying to find a free port.
[2023-01-26 00:43:49.539] [Information] Connector was successfully started on port 56041
You can also open the Console view by pressing Alt+Shift+Q and then Q again, and start typing console in the search bar.
The Polyspace as You Code plugin establishes an internal connection with the analysis engine on the selected port. If you do not specify a port, Polyspace queries your system for an open port and uses the port that your system returns.
Run Analysis
Polyspace analyzes only files that are part of the Eclipse workspace. To add a file to a workspace, you add it to a project in that workspace. Files that are not in the workspace are not analyzed even if you add them to the Quality Monitoring list. If a file that you analyze includes a file that is not in the workspace, the Polyspace as You Code analysis runs but does not report any results in the included file.
On Save
By default, the Polyspace as You Code plugin adds the current file to the Quality Monitoring view on save but does not start the analysis.
To enable the analysis of the current file on save, click ![]() in the Quality Monitoring
view and select Start analysis on save in the
Preferences window. You can also open the preferences by
pressing Alt+W+P.
in the Quality Monitoring
view and select Start analysis on save in the
Preferences window. You can also open the preferences by
pressing Alt+W+P.
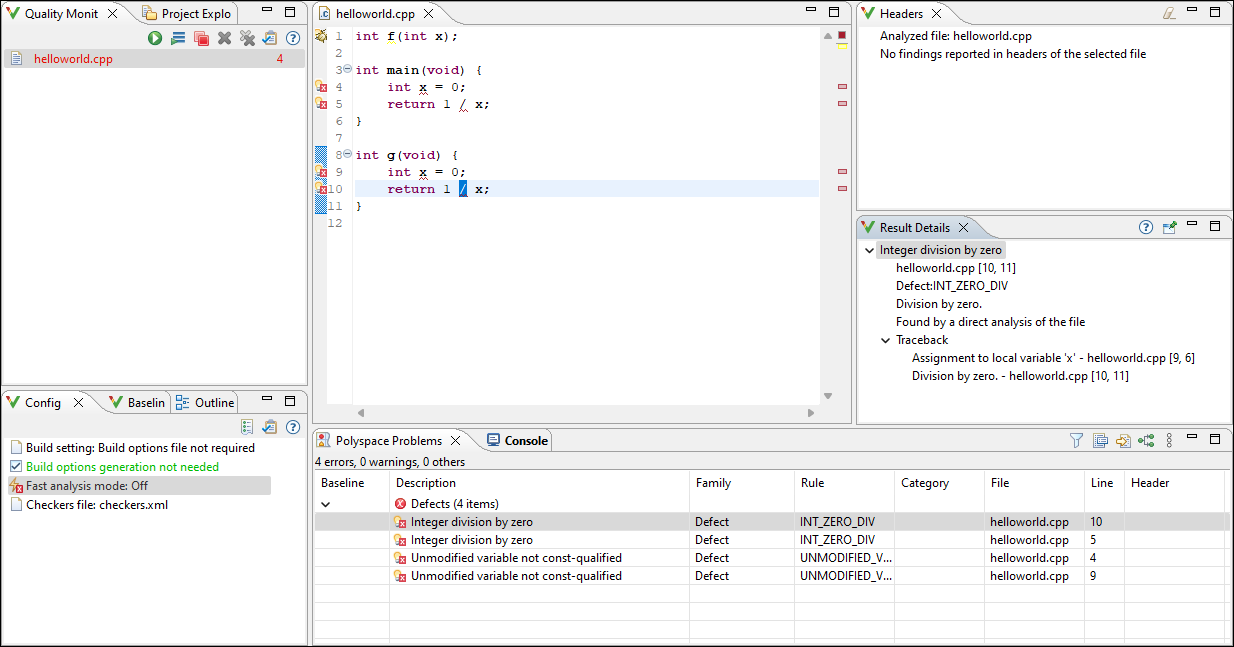
After analysis, results appear as source code markers. You also see the result locations as red marks on the scroll bar. Click a result location to navigate to the corresponding source code. If the analysis fails, check the messages in the Console view to diagnose the cause of the failure.
If results do not appear, see Troubleshoot Failed Analysis or Unexpected Results in Polyspace as You Code.
On Demand
To disable starting an analysis on save, go to the Polyspace as You Code preferences and clear the Start analysis on save checkbox. To start an analysis manually, do one of the following:
Click
 in the Quality
Monitoring view.
in the Quality
Monitoring view.Right-click the file in the editor and click Run Polyspace Analysis.
Review Results
After analysis, you see the results in two forms:
As source code markers. You can point to a source code marker to view more details about the result and view options to justify that result.
In a list on the Polyspace Problems view. If you select a result in the Polyspace Problems view or in the editor, you see additional details about the result in the Result Details view. Click
 to open the contextual help for the
currently selected result.
to open the contextual help for the
currently selected result.
Apply Suggested Fix for Common Defects or Coding Rule Violations
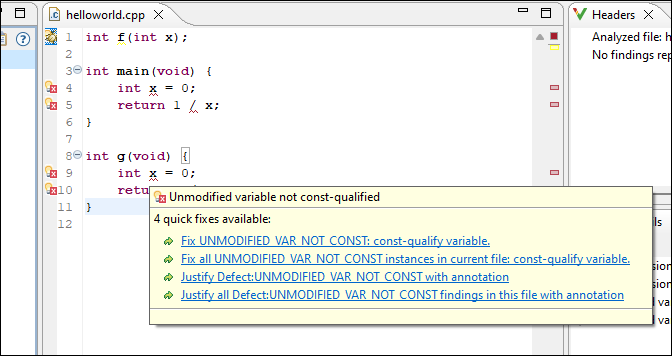
If Polyspace reports certain common defects or coding rule violations in your code, the Polyspace as You Code plugin proposes one or more fixes that you can apply to these results.
To apply a quick fix, hover over a result in the editor and then, from the light
bulb menu, click the appropriate option. The quick fix options have the format
Fix checkerName:
proposedFix. Here,
checkerName is the name of the selected defect
checker or coding rule, and proposedFix is the fix that
Polyspace applies to your code. Polyspace edits your code and fixes the issue or all instances of the issue in
the currently active file, depending on the option that you select. If there is more
than one proposed fix, you see all available fixes in the menu.
This table lists the common defects and coding rule violations for which Polyspace proposes a fix, along with the Polyspace checkers that report these issues.
| Common Defect or Coding Rule Violation | Polyspace Checkers That Report the Issue |
|---|---|
Function that could be evaluated a compile time missing
constexpr specifier |
|
Inefficient use of std::any_cast to cast
object by value |
|
Inefficient use of std::string
operator+() |
|
Inefficient use of the [] operator to
insert or assign a value to a key in a
std::map or
std::unordered_map (C++ 17 and later
only) |
|
| Parameter passed by value results in expensive copy |
|
| Unmodified expensive-to-copy parameter passed by value |
|
Unmodified local variable is created by expensive copy from a
const reference |
|
Unmodified variable not declared
const |
|
Unnecessary call to std::move in a return
statement |
|
| Unused include |
|
| Unused parameter |
|
Use of std::endl |
|
Justify Results Using Code Annotations
If you decide not to fix a result, you can justify the result by adding code annotations. If the annotations follow a specific syntax, subsequent Polyspace as You Code runs can read these annotations and suppress the corresponding result.
To add a code annotation, right-click a result in the Polyspace Problems view and select Polyspace > Justify the current result. The annotation is entered on the same line as the result. You can also apply an annotation by pointing to the code marker for that result.
To mass-justify results of the same defect or coding rule violation in the current file, right-click a result in the Polyspace Problems view and select Polyspace > Justify all instances of the selected finding. Polyspace inserts an annotation in your code on each line that contains this result.
If you import review information from a baseline run, any status, severity, or comment from the baseline run is automatically applied to the corresponding Polyspace as You Code result.
Findings with an imported status of
Not a defect,Justified, orNo action plannedare removed from the Polyspace Problems view and in those results are suppressed in subsequent analyses.
If you select multiple lines of code and then right-click in the Polyspace Problems view, you can select the Polyspace > Justify the current result option to justify each result in the selected code.
Polyspace
as You Code inserts code annotations as comments enclosed in "/*
*/" for C files and prefixed with "//" in C++ files (C++
style). The comment format in C files complies with MISRA C:2004 rule 2.2. See (Not recommended) MISRA C:2004 and MISRA AC AGC Rules (Polyspace Bug Finder).
See also:
View Context-Sensitive Help for Result
You can see more information on a type of result by visiting the context-sensitive help page for the result.
To open the context-sensitive help for a result, select that result in your code or in
the Polyspace Problems view, and then click ![]() in the Result Details
view.
in the Result Details
view.
You can also open the full searchable documentation for the Polyspace
as You Code plugin in your system browser by clicking ![]() in the Baseline,
Configuration, or Quality Monitoring
view.
in the Baseline,
Configuration, or Quality Monitoring
view.
Configure Checkers and Other Settings
Polyspace as You Code checks for a default subset of defects, but you can expand the set of checkers and perform other configuration through the Polyspace as You Code plugin settings in Eclipse. To open the settings, press Alt+W+P and go to the Polyspace as You Code node in the Preferences window.
For instance, you might want to:
Enable or disable certain checkers. See Eclipse: Configure Checkers and Coding Rules in Polyspace as You Code.
Review only new results. See Eclipse: Configure Baseline Results in Polyspace as You Code.
For the full list of settings, see Eclipse: Configure Polyspace as You Code Plugin.